You’re both working full-time. Two salaries hitting your bank account every two weeks. And yet — rent is tight, savings feel impossible, and you can’t quite figure out where the money is going. If this sounds familiar, you’re not alone. For millions of dual-earner households across the United States, two incomes still don’t add up to financial security. This guide explains exactly why — and what the MIT Living Wage Calculator reveals about the real math behind two-worker families.
Figures are general reference estimates. Use the MIT Living Wage Calculator for your county’s actual numbers.
What’s In This Guide
Jump to any section below.
Why Two Incomes Still Fall Short of the Living Wage
There’s a deeply embedded assumption in American personal finance: two incomes equal financial safety. If one salary covers the basics, two salaries must mean security, savings, and breathing room. For a significant slice of dual-earner households — particularly those with children in high-cost metro areas — that assumption simply doesn’t hold.
The reason isn’t that people are spending recklessly. The reason is structural. The costs facing a two-adult, two-earner household don’t scale the same way that income does. Some costs go up when both adults work. Others don’t shrink just because there are two paychecks. And the tax system doesn’t reward combined income the way you might expect.
To understand this, it helps to start with how the MIT Living Wage Calculator frames the question — because it captures this complexity in a way most budgeting conversations miss.
The Three Core Reasons Two-Income Households Still Struggle
Your rent or mortgage is the same whether you earn $60,000 combined or $120,000. So are your car insurance premiums, utilities, and health insurance contributions. These costs consume a larger share of a moderate combined income than many couples realize.
When both parents work outside the home, someone else must care for the children. That someone costs money — often a lot of it. Childcare is essentially a work-enabling expense that single-income households avoid in a very different way. For many dual-income families with young children, childcare is their second-largest monthly expense after housing.
When two incomes combine on a joint tax return, the household’s effective tax rate rises. The so-called “marriage penalty” can push a couple’s combined income into a higher bracket than either would face alone, meaning a meaningful portion of the second salary goes to federal and state taxes rather than to the household budget.
Two adults working means two commutes, two wardrobes (or at least two sets of work-appropriate clothing), and more reliance on convenience food and quick-service meals because there’s less time to cook. These are legitimate work-related costs that rarely appear in basic budget projections.
The Waldev MIT Living Wage Calculator lets you select your exact household configuration — two adults, with or without children — and see the county-level living wage per adult. It’s the fastest way to check whether both incomes are actually covering what your household needs.
How the MIT Calculator Handles Two-Adult Households
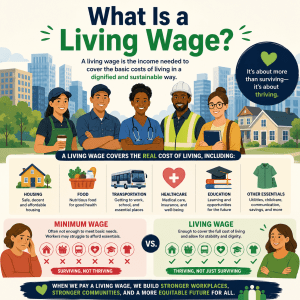
The MIT Living Wage Calculator, maintained by the Massachusetts Institute of Technology and updated regularly with county-level data, is one of the most detailed tools available for estimating what a household genuinely needs to earn to meet basic expenses without relying on public assistance. It covers food, childcare, healthcare, housing, transportation, other basic necessities, and taxes — and it presents the result as an hourly wage, which makes comparisons direct.
Crucially, the calculator includes multiple household configurations. For two-adult households, it offers:
| Household Configuration | Adults Working | What the Living Wage Represents | Key Driver |
|---|---|---|---|
| 2 adults, 0 children | Both adults working | Living wage per adult needed for each partner to cover their equal share of household costs | Housing, healthcare — childcare absent |
| 2 adults, 1 child | Both adults working | Living wage per adult rises significantly due to childcare for one child added to household costs | Childcare, housing |
| 2 adults, 2 children | Both adults working | Further increase per adult; two childcare enrollments compounding the budget pressure | Childcare (×2), housing |
| 2 adults, 3 children | Both adults working | Highest per-adult living wage in the two-adult range; childcare costs for three children push the figure sharply upward | Childcare (×3), housing, food |
| 2 adults, 1 child | One adult working | The working adult’s required wage jumps sharply — one income must cover both adults’ living costs plus childcare | Single-income burden, childcare |
| 2 adults, 2 children | One adult working | The highest single-income living wage in many counties; one earner supporting four people’s basic needs | Single-income burden, childcare (×2) |
Important context: The MIT Living Wage Calculator presents the living wage as the minimum hourly rate required to cover basic expenses. It is not an aspirational income — it is a floor. Households aiming for financial security, savings, or retirement contributions need to earn meaningfully above this threshold. The figures also vary significantly by county. A two-adult, two-child household in rural Mississippi faces a very different number than the same family in San Jose, California.
Reading the Two-Adult Figure Correctly
When the MIT calculator shows a living wage for a two-adult household, it presents a figure per adult. This is an important distinction. If the living wage for a two-adult, two-child household in your county is $28.00 per hour per adult, that means:
        Required combined annual income = $28.00 × 2 adults × 2,080 hours (full-time year) = $116,480


        This means both adults must each earn $28.00/hr working full-time for the household to meet living wage standards.


        If Partner A earns $22/hr and Partner B earns $26/hr, the combined hourly average is $24/hr — below the $28/hr threshold.

        The household is likely running a structural budget deficit even with two full-time paychecks.
Many couples look at their combined annual household income and feel reassured by the total. What they should be doing is dividing by 4,160 hours (two full-time workers at 2,080 hours each) to find the effective combined hourly rate — then comparing that to the MIT living wage per adult for their household type.
You can run this calculation quickly using the free living wage tool on Waldev. Enter your county and household type to see where your household stands.
The Childcare Trap: The Biggest Dual-Income Drain
If there’s one cost that most predictably derails dual-income household finances, it’s childcare. And understanding how the MIT Living Wage Calculator incorporates childcare costs reveals something important: the gap between a childless dual-income couple and the same couple with one or two young children is not incremental. It’s dramatic.
Childcare in the MIT model is treated as a basic necessity — not a luxury, not optional. For households where both adults work, full-time childcare is a required expense, just like food or rent. The model uses county-level childcare cost data to estimate what it actually costs to enroll a child in licensed childcare in your area.
How Childcare Reshapes the Living Wage Per Adult
To make this concrete, consider a hypothetical comparison for a mid-size American city — not a coastal super-city and not a low-cost rural county, but somewhere in the middle of the national distribution. The figures below are illustrative scenarios based on the general structure of MIT Living Wage data and should be verified for your specific county.
| Household Type | Estimated Living Wage / Adult / Hour | Estimated Combined Annual Need | Primary Cost Driver vs. Baseline |
|---|---|---|---|
| 2 adults, 0 children (both working) | ~$18–$22 | ~$75,000–$92,000 | Baseline — no childcare cost |
| 2 adults, 1 child (both working) | ~$24–$30 | ~$100,000–$125,000 | +$15,000–$20,000/yr childcare |
| 2 adults, 2 children (both working) | ~$27–$36 | ~$112,000–$150,000 | +$25,000–$40,000/yr childcare (×2) |
| 2 adults, 3 children (both working) | ~$30–$42 | ~$125,000–$175,000 | +$35,000–$55,000/yr childcare (×3) |
These are illustrative scenario ranges based on the general structure of the MIT Living Wage model. Your actual county figure may be higher or lower. Always check the MIT Living Wage Calculator for your specific location.
What this table illustrates is the jump from a no-child to a two-child household: the living wage per adult can increase by $9–$14 per hour. In annual terms, that’s $18,000–$29,000 more that each adult needs to earn just to maintain a living wage standard. For many couples, that increase outpaces actual wage growth — meaning they are falling further behind the living wage threshold with each child, even as both continue working full-time.
Household: Two adults, two children (ages 2 and 4), living in a mid-sized Midwestern metro area.
Combined gross income: $85,000 — Partner A earns $48,000, Partner B earns $37,000.
On paper: $85,000 feels substantial. The median household income for their state is around $60,000.
Their reality: Childcare for two toddlers in a licensed center costs approximately $2,400 per month ($28,800 per year). After taxes (effective combined rate roughly 22%), their take-home is around $66,300. After childcare, they have $37,500 for everything else: $3,125 per month for rent or mortgage, food, healthcare, transportation, clothing, and any emergency.
MIT Living Wage benchmark for their county: Approximately $28/hr per adult. Their effective hourly rate, averaged across both incomes and both full-time schedules, is approximately $20.40/hr. They are roughly $7.60 per adult per hour below the living wage threshold — even though their household income looks fine from the outside.
For a deeper look at how childcare specifically breaks down within the MIT model’s cost categories, see our dedicated guide on childcare costs and the living wage. It covers center-based care, family daycare, nanny costs, and state subsidy availability in more detail than we can cover here.
DINK Households: Better Off — But Not Always Enough
“DINK” — Dual Income, No Kids — has become shorthand for financial comfort. Two salaries, no childcare, no school supplies, no pediatrician bills. And yes, DINK households generally face a lower living wage threshold than households with children, because childcare is the single largest variable cost the MIT model adds when children arrive.
But DINK status doesn’t automatically mean a household is above the living wage. In high-cost cities, the living wage for a two-adult, no-child household can still be well above $20 per adult per hour — which means couples working in service sectors, retail, hospitality, or early-career roles can fall short even without children in the picture.
Where DINKs Are Usually Fine
Lower-cost metro areas, smaller cities, and rural counties where the living wage for two childless adults sits in the $15–$19/hr range. If both partners earn even modest wages above this floor, the household is likely above the living wage threshold.
Where DINKs Can Still Struggle
High-cost metros like San Francisco, New York, Seattle, Boston, and Washington D.C., where the living wage for two childless adults can approach or exceed $25–$30/hr per person. Entry-level professionals, creative workers, and those in lower-wage industries in these cities can still fall short.
The DINK Living Wage in Three Representative Cities
The table below provides illustrative estimates based on the general range of MIT Living Wage figures for two-adult, no-child households across different cost-of-living environments. These are reference ranges — always verify your specific county using the calculator.
| City / Metro Area | Cost-of-Living Category | Est. Living Wage / Adult (2 adults, 0 children) | Key Driver |
|---|---|---|---|
| Memphis, TN area | Lower cost | ~$16–$18/hr | Housing and healthcare relatively affordable |
| Columbus, OH area | Mid cost | ~$19–$22/hr | Rising housing costs in metro; healthcare market |
| Denver, CO area | Higher cost | ~$23–$27/hr | Rapid housing cost increases since 2018 |
| San Francisco, CA area | Very high cost | ~$29–$36/hr | Extreme housing costs, high state taxes |
Illustrative ranges only. Use the living wage calculator for your county’s actual data.
The takeaway for DINK households: location determines whether two incomes are genuinely sufficient more than almost any other factor. A couple earning a combined $80,000 in Memphis may be well above the living wage. The exact same income in San Francisco places both adults solidly below it.
Three Real-World Dual-Income Scenarios
Theory helps, but scenarios bring the numbers to life. The three situations below represent common dual-income household profiles across the income spectrum. Names and specific details are illustrative, but the financial mechanics are based on the real structure of living wage math.
Household: Two adults, no children. Denver metro area. Renting a 1-bedroom apartment.
Incomes: Partner A: $58,000/yr ($27.88/hr). Partner B: $44,000/yr ($21.15/hr). Combined: $102,000.
Living wage for their county (est.): ~$24/hr per adult for a two-adult, no-child household.
Assessment: Partner A is comfortably above the living wage. Partner B is slightly below. Combined, they meet the threshold — but barely. With Denver’s housing market, a 1-bedroom runs $1,800–$2,200/month. Healthcare, transportation, and student loan payments (common for this demographic) quickly consume the surplus. They’re technically above the living wage as a household but have very limited buffer for savings or emergencies.
What changes everything: A child. Adding one infant would raise the estimated living wage per adult to ~$30–$34/hr — above both their current rates. Even as a DINK couple at $102,000 combined, they would fall below the living wage threshold if they had a child without significant income growth.
Household: Two adults, two children (ages 3 and 6). Columbus, Ohio area. Homeowners with a 30-year mortgage.
Incomes: Partner A: $52,000/yr ($25/hr). Partner B: $38,000/yr ($18.27/hr). Combined: $90,000.
Living wage for their county (est.): ~$27–$29/hr per adult for a two-adult, two-child household (both working).
Assessment: Both partners earn below the living wage per adult threshold for their household type. Combined, they are roughly $12,000–$18,000 per year below where they need to be. They feel it: the kindergartner’s school fees, one child still in daycare ($1,100/month), a car payment, and a mortgage that seemed manageable at purchase but hasn’t scaled with inflation. They likely carry some revolving credit card debt and have minimal retirement contributions.
What the calculator shows: This household is below the living wage not because of poor decisions, but because the structural cost of raising two children in a mid-cost American city requires incomes that most middle-skill jobs don’t yet provide.
Household: Two adults, three children (ages 2, 4, and 8). San Jose, California area. Homeowners.
Incomes: Partner A: $120,000/yr ($57.69/hr). Partner B: $95,000/yr ($45.67/hr). Combined: $215,000.
Living wage for their county (est.): ~$50–$60/hr per adult for a two-adult, three-child household (both working, California costs).
Assessment: On paper, $215,000 sounds like financial freedom. In San Jose, with three children in childcare or after-school programs, California state taxes, a mortgage on even a modest home, two car payments, and healthcare costs, this household is under genuine financial pressure. Partner B at $45.67/hr may actually fall below the living wage threshold for this household type in this county. The family may be asset-rich (equity in the home) but cash-flow tight — a situation that’s increasingly common in high-cost metros.
The lesson: Living wage sufficiency is not just about total income. It’s about the ratio of your income to the specific costs of your household type, location, and family size. Running those numbers through the MIT calculator for your county provides a reality check that gross income figures alone never will.
What Happens When One Parent Steps Back
For many families with young children, particularly when childcare costs approach or exceed what one partner earns, a natural question arises: Does it actually make financial sense for both of us to keep working? It’s a legitimate question, and the MIT Living Wage Calculator illuminates the answer in a way that most conversations about “the stay-at-home parent decision” don’t.
The critical thing to understand is that stepping back from work doesn’t just eliminate the second income — it changes the entire living wage calculation for the household. The MIT calculator has separate configurations for two-adult households where one adult works, and the living wage required of that single earner is dramatically higher than the per-adult figure for a two-earner household.
The Single-Earner Living Wage Shock
When one adult stops working in a two-adult household, three things happen simultaneously:
If children were in full-time paid childcare, that expense may be reduced or eliminated — which is often the primary motivation for one parent stepping back. This is a real cost saving.
Even if the second income was netting only $20,000 after all work-related costs, its loss reduces household purchasing power. Benefits like employer health insurance may also disappear if they were tied to the non-working parent’s job.
The MIT calculator’s “one adult working” figures require that single income to cover two adults’ basic living costs (housing, healthcare, food, transportation) plus childcare for any children who still need paid care. This often pushes the required hourly rate 30–70% above the per-adult figure for the two-earner version of the same household.
| Household Configuration | Adults Working | Est. Living Wage Required (mid-cost metro) | Change from Two-Earner Version |
|---|---|---|---|
| 2 adults, 1 child | Both working | ~$26/hr per adult | Baseline |
| 2 adults, 1 child | One working | ~$38–$45/hr (single earner) | +46–73% required from sole earner |
| 2 adults, 2 children | Both working | ~$30/hr per adult | Baseline |
| 2 adults, 2 children | One working | ~$44–$55/hr (single earner) | +47–83% required from sole earner |
Illustrative estimates. Check your county using the MIT Living Wage Calculator for precise figures.
This analysis doesn’t mean staying home is the wrong choice. For many families, the combination of childcare savings, reduced commuting costs, and time investments in the household creates real economic value. But the decision should be made with clear eyes about what the remaining earner must now earn to keep the household at a living wage standard — and whether that number is realistically achievable in their career and location.
For a fuller exploration of how family size affects the living wage calculation across different household structures, see our guide on how the living wage changes when you have kids.
How Dual-Income Couples Close the Gap
If you’ve run the numbers and discovered that your two-income household is below — or only barely above — the living wage for your county and household type, the natural question is: what can you actually do about it? The answer is rarely a single move. It’s usually a combination of adjustments across income, costs, and location.
📈 Income-side moves
Renegotiate or job-hop for salary growth. The largest income gains for most workers come from switching employers rather than waiting for raises. Both partners should evaluate whether they’re being paid at or above market rate for their role and location. Use the MIT living wage figure as a floor, not a ceiling — you’re aiming to be meaningfully above it.
If one partner has strong career momentum and the other is in a stagnant role, it may be worth one partner temporarily deprioritizing advancement to support the other’s career growth — producing larger combined income gains over three to five years than both pursuing incremental raises simultaneously.
🏠 Location adjustments
The single most powerful lever for dual-income households below the living wage is geographic. Moving from a high-cost to a mid-cost metro area can reduce the required living wage per adult by $8–$15/hr without any income change. Remote work has made this viable for many professional couples for the first time.
Before moving, use the MIT calculator to compare your current county’s living wage with the target county — and factor in realistic salary expectations for your roles in both markets. The goal is a location where local wages and local costs produce a positive gap.
🧒 Childcare cost reduction
Employer-sponsored Dependent Care FSAs allow up to $5,000 per year in pre-tax dollars for childcare — an effective discount of 22–32% depending on your tax bracket. Many dual-income couples leave this benefit unused.
Family daycare providers (in-home licensed care) typically cost 20–40% less than center-based care with comparable licensing. Au pair arrangements can be cost-competitive for families with two or more children simultaneously. And some employers now offer childcare subsidies or backup care programs that reduce out-of-pocket costs meaningfully.
💡 Benefit optimization
Health insurance is often a significant hidden inefficiency. Many dual-income couples independently enroll in employer-provided health plans when one plan, chosen carefully, would provide equivalent coverage for both adults and children at lower total cost. Compare your two employers’ plan costs and coverage annually — especially during open enrollment — and model the cost of covering your family on one plan versus two.
Similarly, ensure you’re capturing all available tax credits: the Child Tax Credit, Child and Dependent Care Credit, and Earned Income Tax Credit (for eligible income ranges) can meaningfully change the household’s effective tax burden.
The Honest Long-Term Play
For many dual-income households below the living wage, the gap won’t close immediately. Living wages are rising as the MIT data is updated to reflect higher costs — housing in particular. Incomes don’t always keep pace. The structural reality is that a significant portion of American dual-earner families are doing everything “right” and still falling short of a basic living wage standard for their household type.
Understanding exactly where you stand is the first productive step. Use the living wage calculator to find your household’s specific number, compare it honestly to each partner’s current earnings, and work from a clear picture of the gap rather than a vague sense that money is tight. Clarity, even when it’s uncomfortable, is where planning starts.
Our self-assessment guide walks you through comparing your household’s income to the MIT living wage benchmark — individually and combined — with a step-by-step framework for identifying your gap and deciding what to do next.
Dual-Income Household Living Wage Gap: A Summary View
The table below maps common dual-income household profiles to their likely position relative to the living wage benchmark, based on the general structure of MIT Living Wage data. This is a planning reference, not a substitute for checking your specific county.
| Household Profile | Cost-of-Living Environment | Likely Position vs. Living Wage | Primary Risk Factor |
|---|---|---|---|
| DINK, both earning $20+/hr | Low-to-mid cost area | ✓ Above threshold | Minimal — watch housing costs if renting |
| DINK, both earning $20+/hr | High-cost metro | ⚠ Near or below threshold | Housing cost growth; city-specific threshold may be $28–$35/hr |
| 2 adults, 1 child, combined $85K | Mid-cost metro | ⚠ Near threshold | Childcare cost relative to income; marginal tax rate |
| 2 adults, 2 children, combined $85K | Mid-cost metro | ✗ Below threshold | Dual childcare cost; living wage requires ~$112–$125K at mid-cost |
| 2 adults, 2 children, combined $110K | Mid-cost metro | ⚠ Near threshold | May meet living wage but limited buffer for savings |
| 2 adults, 2 children, combined $110K | High-cost metro | ✗ Below threshold | Living wage for high-cost 2+2 household may require $150K+ |
| 2 adults, 1 child — one parent not working | Any metro | ✗ High risk | Single earner must cover two adults + childcare; threshold rises 40–75% |
All figures are illustrative reference ranges based on the general structure of MIT Living Wage data. Use the Waldev MIT Living Wage Calculator to look up your specific county and household configuration.
Frequently Asked Questions
Common questions about dual-income households and the living wage.
Does the MIT Living Wage Calculator have a two-adult household option?
Yes. The MIT Living Wage Calculator includes multiple household configurations including two adults with zero, one, two, or three children, with options for both adults working or one adult working. This lets dual-earner couples look up the specific living wage benchmark for their household type and county. You can access it through the Waldev MIT Living Wage Calculator.
Why do two incomes sometimes not feel like enough to live on?
Two incomes rarely double your financial security. Fixed costs like housing, childcare, and healthcare don’t scale proportionally with income. In particular, childcare — which can exceed $1,500 per month per child in many cities — is a direct cost of both adults working that single-income households don’t face in the same way. Tax rates also climb with combined income, reducing the marginal gain from a second salary. And work-related costs (commuting, clothing, convenience meals) add up across two working adults simultaneously.
What is the living wage for a two-adult, two-child household in the US?
The MIT Living Wage Calculator estimates the living wage for a two-adult, two-child household where both adults work at around $25–$40 per hour per adult depending on the county. In high-cost metropolitan areas like San Francisco, New York, or Seattle, the figure can exceed $40 per hour per adult. The exact number varies significantly by location and should be checked for your specific county using the MIT calculator at Waldev.
Is a DINK (dual income, no kids) household guaranteed to earn above the living wage?
Not necessarily. In high-cost cities, the living wage for two adults with no children can still be above $25–$30 per hour per adult. If one or both partners work in low-wage sectors, earn part-time, or face high housing costs, a DINK household can still fall short of the living wage benchmark for their area. DINK households have a significant advantage over families with children — primarily because childcare costs don’t apply — but location remains the dominant variable.
Does adding a second income always improve a household’s financial position?
Adding a second income improves total household revenue, but the net gain is often smaller than expected. Childcare costs, higher marginal tax rates on combined income, work-related expenses (commuting, clothing, meals), and the loss of public benefit eligibility can all reduce the real benefit of a second paycheck. Couples should calculate the net after-tax, after-cost gain from both incomes rather than comparing gross salaries. For some households with multiple young children in expensive childcare markets, the net contribution of the lower-earning partner can be surprisingly modest.
What happens to the living wage calculation when one parent stops working?
When one adult in a two-adult household stops working, the MIT calculator’s “one adult working” configuration applies. The living wage for the working adult jumps significantly because a single income must now cover all household costs including the living expenses of a non-working adult and any children. The working adult’s required hourly wage can increase by 30–75% compared to the two-earner version of the same household. This doesn’t mean staying home is the wrong decision — it means families should know the real income requirement before making the choice.
How do dual-income households know if they are earning a living wage?
The best starting point is to look up your specific household configuration in the MIT Living Wage Calculator using your county. Then compare the required hourly wage per adult against each partner’s actual hourly earnings. If one or both partners fall below the threshold, the household is likely running a structural budget deficit even with two incomes. The Waldev MIT Living Wage Calculator makes it easy to check your number quickly without any account creation required.
Find Your Household’s Living Wage in Under Two Minutes
If you’ve read this far, you now understand why the “two incomes = financial security” equation so often fails in practice. The next step is simple: run the actual numbers for your household.
The MIT Living Wage Calculator on Waldev lets you select your county, choose your household configuration — including every two-adult combination with or without children — and immediately see the living wage per adult that applies to your situation. No account, no email, no paywall.
Use it to answer the questions that matter: Are both incomes above the threshold? How much are you above or below? What would change if you had another child, moved to a different county, or one partner stepped back from full-time work? The calculator gives you the county-level data to model any of these scenarios honestly.
📊 Before making any major financial decision as a dual-income household — moving, having a child, one partner stepping back — run the numbers with the calculator. It takes less time than the conversation, and it gives that conversation a factual foundation.
How the living wage changes when you have kids — How family size affects the calculation at each step.
Childcare costs and the living wage — A dedicated deep-dive into the childcare cost component of the MIT model.
What a living wage budget actually looks like — All six cost categories in the MIT model, broken down with real spending ranges.
Living wage vs. a comfortable income — The gap between covering basic needs and actually getting ahead financially.
Disclaimer: This article uses illustrative income and cost figures for educational purposes. All living wage figures referenced are general estimates based on the structure of MIT Living Wage Calculator data and vary significantly by county. They should not be used as financial advice. For precise figures applicable to your household and location, always consult the MIT Living Wage Calculator directly. Personal financial decisions should be made in consultation with a qualified financial professional where appropriate.