Millions of working Americans bring home a paycheck every week and still can’t comfortably cover their bills. This is not a budgeting failure — it is a math problem. When your income falls below the living wage for your area and household, specific and predictable things happen: debt builds, healthcare gets deferred, stress compounds, and the gap becomes harder to close over time. This guide walks through what actually happens, why, and what realistic options exist.
What the Gap Between Your Income and the Living Wage Actually Looks Like
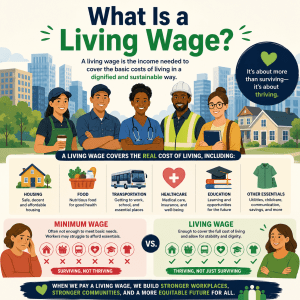
Before examining the consequences, it helps to understand the scale of the problem. The living wage is not a comfortable income — it is the calculated floor below which a person cannot cover their basic necessities without taking on debt or outside help. When someone earns below that floor, the shortfall is not abstract; it shows up in specific line items every month.
MIT’s Living Wage Project calculates the living wage at the county level for different household compositions. A single adult in a moderate-cost U.S. city might need roughly $21–$24 per hour to meet their basic needs. A single parent with one child in the same city might need $32–$40 per hour. The federal minimum wage has remained at $7.25 per hour since 2009. Even in states with higher minimum wages, the gap between the minimum wage and the living wage is often substantial — sometimes $8–$15 per hour or more depending on location.
To make this concrete, consider what that gap looks like in dollars per month:
| Household Type | Example Living Wage ($/hr) | Example Actual Wage ($/hr) | Annual Gap (approx.) | Monthly Shortfall |
|---|---|---|---|---|
| Single adult, no children | $22.00 | $15.00 | ~$14,560 | ~$1,213 |
| Single adult, 1 child | $36.00 | $18.00 | ~$37,440 | ~$3,120 |
| 2 adults (1 working), 2 children | $42.00 | $22.00 | ~$41,600 | ~$3,467 |
| 2 adults (both working), 1 child | $23.00/adult | $17.00/adult | ~$12,480 | ~$1,040 |
Figures are illustrative, using rounded mid-range estimates for a moderate-cost U.S. metro area. Actual living wages vary significantly by county and household composition.
These figures assume full-time, year-round employment. A monthly shortfall of $1,000–$3,000 is not something you solve by skipping lattes. It represents a structural imbalance between what the local cost of living requires and what the labor market pays. When that imbalance is persistent — not a temporary rough patch but a long-term feature of someone’s employment — the consequences compound in ways that are very difficult to reverse.
The MIT Living Wage Calculator on Waldev gives you the precise county-level figure for your household type. Before reading further, it’s worth knowing exactly how large your gap is — or confirming you’re above the threshold.
The Difference Between a Temporary Shortfall and a Structural Shortfall
Most households experience occasional months where expenses exceed income — an unexpected car repair, a medical bill, a gap between jobs. These temporary shortfalls can often be absorbed by savings, family support, or one-time adjustments. The situation described in this article is different: a persistent, recurring gap where income is consistently below what the local economy requires for basic stability.
The distinction matters because temporary shortfalls respond to temporary fixes. Structural shortfalls do not. They require either an increase in income, a decrease in the cost of living (which often means moving), or long-term reliance on public assistance — none of which are quick or easy adjustments.
The Debt Accumulation Pattern
The most predictable financial consequence of sustained below-living-wage income is debt. When monthly expenses exceed monthly income — even by a few hundred dollars — something has to fill the gap. For most people, that something is credit.
The progression typically follows a recognizable pattern. In the early months, people draw on savings if they have any. When savings run out, they begin carrying balances on credit cards. As balances build, minimum payments increase, which makes the monthly gap larger — meaning more is charged to the card each month than was originally needed. When credit cards reach their limits, people turn to higher-cost borrowing: payday loans, rent-to-own arrangements, or informal borrowing from family members.
How a $300 Monthly Shortfall Becomes a Debt Crisis Over Two Years
A single adult earns $15 per hour full-time in a city where the living wage is $21 per hour. After taxes, their take-home is approximately $2,050 per month. Their basic expenses — rent, utilities, food, transportation, healthcare copays, phone — total approximately $2,350 per month. The gap is $300 per month.
In month one, they use a credit card. In month six, the card balance is $1,800, and minimum payments of $45 per month have made the effective monthly shortfall $345. By month twelve, the balance is $4,100, minimum payments are $100 per month, and the shortfall has grown to $400 per month. By month twenty-four, the balance has reached $9,000, interest charges alone are $150 per month, and the worker is paying $250 per month in minimum payments simply to prevent further credit damage — money that was never part of their original budget gap.
The original $300 per month problem has become a $450 per month problem, and the $9,000 balance would take over a decade to eliminate at the rates they can afford to pay.
High-Cost Borrowing: The Payday Loan Trap
For people who do not have credit cards or whose cards are maxed out, payday loans and similar products become the last resort. These products are specifically marketed to people whose income falls short of their expenses — and their pricing structure makes the shortfall worse, not better.
A typical payday loan charges a fee of $15–$20 per $100 borrowed, which translates to an annual percentage rate of 300–400%. A person who borrows $400 to cover rent on the 28th of the month and repays it on the 10th of the following month has not solved their problem — they have borrowed against next month’s income, meaning next month they will have $400 less to work with and will likely need to borrow again. This is the payday loan cycle: a structural shortfall that borrowing cannot fix, serviced by an industry whose profitability depends on repeat customers.
The key insight: Debt is not a symptom of irresponsible behavior in this context. It is the rational response to a math problem — when income is genuinely below the cost of living, borrowing is often the only short-term option available. The problem is that borrowing at high cost accelerates the long-term gap rather than closing it.
How Debt Limits Future Options
Accumulated debt does more than strain monthly budgets. It also limits the options available to close the income gap in the future. A person with a damaged credit score cannot rent a better apartment in a lower-cost area. They cannot qualify for an auto loan to buy a more reliable vehicle to reach a better-paying job. They cannot access the personal loans that might help them pay for a credential or certification. They may face background check issues in job applications, since some employers check credit as part of hiring. The original income problem creates a debt problem that then makes the income problem harder to solve.
Healthcare Delays and Their Long-Term Consequences
When income falls below the cost of living, healthcare is one of the first categories to get cut. It is highly compressible in ways that rent or food are not. You can skip a doctor’s appointment. You cannot skip rent without facing eviction. This makes healthcare a frequent sacrifice — and a consequential one.
The Most Common Healthcare Trade-Offs
Skipping preventive care. Annual physicals, dental cleanings, vision exams, and screenings are deferred when income is tight. These are precisely the services most likely to catch conditions early, when they are cheaper and easier to treat.
Not filling prescriptions. A study by the Kaiser Family Foundation found that a significant share of working-age adults with low incomes report not taking medications as prescribed because of cost — cutting pills in half, skipping doses, or simply not filling prescriptions.
Ignoring symptoms. People earning below the living wage are more likely to wait until a health problem becomes acute before seeking care — at which point it is more expensive to treat, more likely to require hospitalization, and more likely to result in lost work time.
Using the emergency room for primary care. Without regular access to a primary care physician, minor health issues accumulate and eventually result in an emergency room visit — the most expensive form of healthcare delivery, often generating bills that become additional debt.
Declining employer-sponsored coverage. When employer coverage requires employee premium contributions that strain an already-tight budget, some low-wage workers opt out of coverage entirely — eliminating the cost today at the expense of dramatically higher costs if something goes wrong.
The Cost of Deferred Care
These trade-offs create a predictable pattern: deferred care becomes more expensive care. A dental issue that would have cost $150 to treat in year one costs $1,200 to treat in year three after the infection spreads. A managed chronic condition that requires $80 per month in medications — a cost some workers cannot absorb — becomes an emergency hospitalization that generates $15,000 in bills. The short-term savings of skipping care produce long-term costs that are far larger.
This is not a personal failing. It is the predictable result of a system in which healthcare costs are structured as optional monthly expenses at a moment when monthly income is already insufficient.
The MIT living wage model includes healthcare costs as one of its core expense categories — which is part of why the living wage is higher than many people expect. If you are wondering how your wage compares to what’s needed in your county, the living wage calculator breaks down the healthcare component of the threshold alongside housing, food, and transportation.
Housing Instability: The Most Visible Consequence
Housing is typically the largest single expense in a household budget — and when income falls short of the living wage, housing is where the shortage becomes most visible and most dangerous. Housing instability exists on a spectrum from paying rent late to eviction, and each point on that spectrum has consequences that extend far beyond the housing situation itself.
What Housing Instability Actually Means
Paying Late or Partial
Rent is paid after the due date or only partially. This typically incurs late fees of $50–$150, which add to the monthly burden. Relationships with landlords deteriorate. Future rental applications become more difficult if landlords check payment history.
Doubling Up
To reduce rent burden, people move in with family or friends — sometimes multiple households sharing a single rental unit. This can work for short periods but creates instability in relationships, overcrowding, and lack of legal tenancy rights for the additional occupants.
Frequent Moving
Workers unable to maintain housing in a given location may move repeatedly in search of lower rent — disrupting children’s schooling, increasing transportation costs to work, straining social support networks, and generating moving costs that further strain the budget.
Eviction and Displacement
An eviction record is one of the most damaging things that can happen to a low-income tenant. It dramatically restricts future housing options, since most landlords screen for eviction history. Eviction also frequently leads to employment disruption — a mailing address is required for most job applications.
The Hidden Costs of Inadequate Housing
When people cannot afford adequate housing in their current location, they often make trade-offs that have downstream costs. Moving farther from work to access cheaper rent increases transportation costs and commute time — a double expense in both money and hours. Overcrowded housing creates health risks, particularly for children and elderly residents. Housing in lower-cost areas of a metro often means lower-quality schools for children, which affects long-term economic outcomes for the next generation.
The 30% rule — the widely cited guideline that housing should not exceed 30% of gross income — is useful as a general benchmark, but it was developed decades ago and does not account for the reality that in many U.S. metros, a full-time worker earning a minimum wage would need to spend 50–70% of their income to afford even a modest one-bedroom apartment. The math does not work.
Food Insecurity Among Working Adults
One of the most persistent misconceptions about food insecurity is that it primarily affects people who are unemployed. The data consistently shows otherwise. A significant share of food-insecure households in the United States include at least one working adult. Earning a paycheck does not guarantee food security when the paycheck falls short of what local life costs.
What Below-Living-Wage Food Insecurity Looks Like
Food insecurity among workers with below-living-wage income rarely looks like missing meals entirely. It more often manifests as:
Caloric Adequacy Over Nutritional Quality
When the food budget is squeezed, people prioritize caloric density over nutritional quality. Processed foods, pasta, rice, and canned goods cost less per calorie than fresh vegetables, lean proteins, and whole grains. The result is adequate calories but insufficient nutrition — which has long-term health consequences.
Food Bank Dependence
Many working adults below the living wage rely on food pantries and community food programs to supplement their grocery budgets. This is an effective short-term resource, but access is uneven — rural areas and food deserts have fewer options, and access requires time and transportation that not everyone has.
End-of-Month Shortfalls
SNAP (food assistance) benefits, if received, are issued once per month. Many low-income households run out of food money in the third or fourth week of the month — a pattern researchers call “food stamp cycling” — and manage on minimal food until the next month’s benefits arrive.
Children’s Food Prioritization
Parents below the living wage frequently report eating less themselves so that their children can eat adequately. This parental self-sacrifice is admirable but unsustainable and has long-term consequences for the parent’s own health and capacity to work.
The connection between food insecurity and the living wage is direct: the MIT model allocates a specific food cost budget in its living wage calculation, based on USDA “low-cost food plan” estimates for different household sizes. When income falls below the living wage, the food budget is one of the first categories to be compressed — and the health and wellbeing consequences follow predictably.
The Stress and Mental Health Toll of Earning Below the Living Wage
The financial consequences of below-living-wage income are well documented. Less often discussed — but equally important — are the psychological consequences. Sustained financial insecurity produces a recognizable pattern of stress responses that affect decision-making, relationships, and long-term health in ways that extend far beyond the bank balance.
Financial Scarcity Changes How the Brain Works
Research in behavioral economics has produced a significant body of evidence that financial scarcity — the persistent awareness that there is not enough money to cover basic needs — consumes cognitive bandwidth. When a substantial portion of mental resources is devoted to managing financial shortfalls, less is available for everything else: problem-solving, planning, maintaining relationships, and exercising patience and self-regulation.
This is not a character failing. It is a cognitive load problem. A person who is constantly calculating whether they have enough money to cover this week’s groceries and next week’s rent is operating with a meaningful portion of their working memory perpetually occupied. This has measurable effects on performance at work, engagement with children, quality of decisions in other domains of life, and the ability to plan and execute strategies for improving their situation.
Anxiety, Depression, and Physical Health
Chronic financial stress has physiological effects. Sustained exposure to stress hormones like cortisol is associated with disrupted sleep, weakened immune function, higher blood pressure, and increased risk of cardiovascular disease. The mental health consequences — anxiety and depression — are well established in the research literature linking poverty and near-poverty income to psychological distress.
The link runs in both directions. Financial stress causes mental health problems. Mental health problems make financial recovery harder — through reduced work performance, disrupted attendance, difficulty maintaining the sustained effort required to pursue better employment or additional education. This is not a cycle that willpower alone breaks.
Decision Fatigue and the “Bandwidth Tax”
Studies have found that when people are asked to contemplate a difficult financial scenario — like an unexpected car repair — those with limited financial resources subsequently perform worse on cognitive tasks that test executive function. The same result was not found when the hypothetical expense was trivial. The implication is that financial scarcity imposes a real-time cognitive tax that affects how people think and decide across all areas of their lives, not just their finances.
For someone earning persistently below the living wage, that tax is not occasional. It is continuous. Every grocery trip, every bill that arrives, every decision about whether to fill a prescription or buy food involves the same exhausting mental math. The cumulative cognitive and emotional cost is substantial.
Relationship and Family Strain
Financial stress is consistently cited as one of the leading causes of relationship conflict and breakdown. For couples and families below the living wage, arguments about money are frequent, often intense, and difficult to resolve because the underlying problem — income that falls short of expenses — is not something that can be settled by changing behavior. The conflict continues because the math continues.
For single parents, the strain is particularly acute. Managing below-living-wage income while raising children, without the shared burden of a second adult, while trying to remain emotionally present and consistent for children who are themselves affected by the household stress — this is an extraordinary amount to sustain over time. It is worth acknowledging clearly: the difficulty people in this situation face is not a reflection of effort or character. It is a reflection of genuinely impossible arithmetic.
For a deeper look at the mental health and financial stress connection, see our article on Living Wage and Mental Health: The Financial Stress Connection, which examines the research in more detail and discusses what helps.
How Below-Living-Wage Income Affects Children’s Outcomes
The consequences of earning below the living wage do not stop at the adult worker. For households with children, the impact extends across every dimension of a child’s development — educational, physical, psychological, and ultimately economic.
Educational Outcomes
Children in households below the living wage face a range of educational disadvantages that are not primarily about their parents’ engagement or values, but about material conditions. Inadequate housing means frequent moves and school changes, which disrupts the learning process and social development. Food insecurity — specifically, coming to school hungry — measurably affects concentration and academic performance. Limited access to school supplies, transportation, extracurricular activities, and tutoring compounds over time.
The research on early childhood development is particularly clear: the first five years of life are the period of greatest brain development, and the quality of nutrition, housing stability, stress exposure, and cognitive stimulation during this period has long-term effects on learning capacity. Children raised in below-living-wage households are more likely to enter kindergarten with lower literacy and numeracy skills — a gap that evidence shows tends to persist and widen rather than close through schooling alone.
The Intergenerational Effect
Perhaps the most consequential impact of sustained below-living-wage income on households with children is intergenerational. Children who grow up in households with persistent financial insecurity are statistically more likely to experience financial insecurity as adults. This is not deterministic, and individual outcomes vary widely. But the structural factors that make below-living-wage income difficult to escape for adults — limited savings, limited educational attainment, credit damage, reduced job mobility — tend to be transmitted to children in attenuated but real forms.
This is one reason why the living wage debate is not simply about current adult workers. It is about the cumulative effect of wage structures on household stability across generations.
For single parents specifically: The living wage threshold for single-parent households is dramatically higher than for other household types — often the highest of all configurations in a given county. Our detailed look at living wage figures for single parents breaks down what the numbers actually show and why the gap is so large.
Programs That Help Bridge the Gap
For households earning below the living wage, a range of federal and state programs exist specifically to supplement income and reduce the cost of essential needs. These programs do not solve the underlying income problem — they are not designed to — but they can meaningfully reduce the monthly shortfall and prevent the most acute consequences described above.
The critical thing to understand about these programs is that eligibility varies by state, by household size, and by income relative to the federal poverty level (FPL). The living wage is typically well above the federal poverty level — meaning people earning below the living wage may or may not qualify for specific programs depending on exactly how far below the living wage they fall.
| Program | What It Covers | Typical Eligibility Threshold | Key Notes |
|---|---|---|---|
| SNAP Supplemental Nutrition Assistance Program |
Grocery costs | Up to 130% of FPL (gross income) | Benefits average $6–$7/day per person; varies by household income and size |
| Medicaid / CHIP | Health insurance | Medicaid expansion states: up to 138% FPL; CHIP for children: up to 200–300% FPL by state | Eliminates or greatly reduces healthcare costs for qualifying households; varies significantly by state |
| ACA Marketplace Subsidies | Health insurance premiums | 100–400% FPL (enhanced subsidies now extend higher) | Premium tax credits reduce monthly insurance cost; must enroll during open enrollment period |
| Section 8 / Housing Choice Voucher | Rent subsidy | Generally below 50% of area median income | Wait lists in many areas are years long; availability is the primary constraint |
| EITC Earned Income Tax Credit |
Annual tax refund / income supplement | Working adults with income below $63,398 (varies by filing status and children, 2024) | One of the most significant income supplements for low-wage workers; paid annually at tax time |
| Child Tax Credit | Annual tax benefit per child | Phases out at higher income levels; partially refundable at lower incomes | Provides meaningful annual support for families with children; value varies by income |
| LIHEAP Low Income Home Energy Assistance |
Heating and cooling bills | Up to 150% FPL; varies by state | Seasonal; availability is inconsistent and funding is limited |
| WIC | Food, formula, and nutrition support | Pregnant women, new mothers, infants, and children up to age 5 at up to 185% FPL | Not the same as SNAP; specifically targets prenatal and early childhood nutrition |
| CCDF / State Childcare Subsidies | Childcare costs | Varies significantly by state; generally targets families below 85% of state median income | Wait lists common; childcare subsidies can be transformative for working parents when available |
The Benefit Cliff Problem
One of the most frustrating features of the assistance landscape is the “benefit cliff” — the point at which a small wage increase causes a disproportionate loss of benefits. A worker who receives Medicaid, SNAP, and a childcare subsidy and earns a $1.50/hour raise might find that the raise pushes their income above the eligibility threshold for one or more programs — resulting in a net decrease in total resources even though their wage increased.
This is a real structural feature of the current assistance landscape, and it means that workers below the living wage sometimes have a complicated financial relationship with wage increases. Getting above a threshold can make you worse off in the short term if it triggers a loss of coverage. This creates genuine disincentives in the $15–$25/hour range, where multiple program eligibility thresholds cluster, and it is one of the most discussed and least resolved tensions in low-income policy design.
Before assuming you don’t qualify: Many workers who are eligible for programs like SNAP, the EITC, or Medicaid never apply because they assume they make too much, or because the application process feels overwhelming. Benefits calculators and nonprofit benefit navigators exist in most states to help people understand what they qualify for. It is worth checking, particularly for the EITC, which is a direct cash benefit at tax time and is widely underutilized.
Realistic Paths Forward When Your Income Falls Below the Living Wage
There is no single answer to closing the gap between current income and the living wage. The right path depends on the size of the gap, the local labor market, household composition, existing credentials, available time, and a dozen other factors that vary by person. What follows are the approaches that have the strongest evidence base — not miracle solutions, but genuine levers that people in this situation have used to improve their position over time.
Before anything else, know the precise living wage threshold for your household and county. The gap between a single adult without children and a single parent with two children can be $20/hour or more. The gap between the same household in a rural county and a major metro can be $8–$12/hour. Your specific number is what matters — not national averages. Use the MIT Living Wage Calculator to get it. Understanding the size of the gap is the prerequisite to deciding which strategies are realistically achievable in your timeframe.
Benefits reduce the effective cost of living, which narrows the gap without requiring a wage increase. SNAP, Medicaid, CHIP for children, the EITC at tax time, utility assistance, and childcare subsidies can collectively add thousands of dollars of annual value to a household budget. This is not a long-term solution, but it is a real and immediate one. Look up your state’s 211 helpline or benefits.gov for a starting point on eligibility screening.
The fastest path to a higher wage is often negotiating within your current role rather than switching jobs. Workers who understand what their labor market pays — using data sources like the Bureau of Labor Statistics occupational wage surveys and the local living wage figure as anchors — are significantly more likely to successfully negotiate raises. Our article on using living wage data to negotiate your salary covers this in practical detail.
Four-year degree programs are not the only path to a wage increase. Many community college certificate programs, trade apprenticeships, and online certifications can be completed in six to eighteen months and deliver meaningful wage increases — particularly in healthcare (medical assistants, phlebotomists, LPNs), technology (IT support, coding bootcamps), skilled trades (HVAC, electrical apprenticeships), and transportation (CDL licensing). The key is targeting programs with high regional employment demand and short time-to-completion. Many are available at low or no cost through Pell Grants and workforce development programs.
The living wage is not just a wage number — it is a ratio of wages to local costs. Moving to a lower-cost area can sometimes close the gap faster than a wage increase, particularly if remote work makes it possible to maintain a current salary in a lower-cost location. This is not available to everyone and involves real trade-offs (proximity to family, established social networks, familiarity), but it deserves to be evaluated honestly. The same income that leaves a household below the living wage in San Francisco may comfortably exceed it in a smaller city or rural county.
When income is tight, maintaining credit — even imperfectly — and saving even small amounts ($10–$25 per paycheck) serves as a buffer against the debt spiral described earlier. An emergency fund of even $500–$1,000 dramatically reduces the likelihood of turning to high-cost borrowing when an unexpected expense hits. Credit unions and community banks often offer savings products specifically designed for this situation.
A note on realistic timelines: None of these steps close a large wage gap immediately. A $300/month shortfall at current wages might take 12–24 months of sustained effort across multiple strategies to close. The goal is not to solve everything at once — it is to stabilize the immediate situation while working toward structural improvement. Progress is worth measuring even when the destination still feels far.
Frequently Asked Questions
What does it mean to earn below the living wage?
Earning below the living wage means your income is not enough to cover the basic costs of living in your area — including housing, food, transportation, healthcare, and childcare if applicable — without taking on debt or relying on public assistance. The living wage threshold varies by county and household composition; it is not a single national number. The MIT Living Wage Calculator provides county-level estimates for different household types.
Can you survive on less than the living wage?
Many people do survive on below-living-wage incomes, but typically only by making painful trade-offs — skipping healthcare, living in overcrowded housing, relying on food banks, accumulating credit card debt, or depending on help from family. It is survival, not stability. The consequences described in this article — debt, deferred healthcare, food insecurity, housing instability, and stress — are what “surviving” below the living wage usually looks like in practice.
What is the most common consequence of earning below the living wage?
Debt accumulation is the most common financial consequence. When monthly expenses exceed monthly income — even slightly — something has to fill the gap. For most people, that is credit: credit cards first, then higher-cost borrowing as card balances grow. The debt itself then increases monthly obligations, which makes the gap larger over time. This is why a relatively small initial shortfall can compound into a significant debt problem over one to two years.
Does earning below the living wage affect your health?
Yes. Research consistently links below-living-wage income to worse physical and mental health outcomes — higher rates of anxiety and depression, delayed medical care, poorer nutrition, disrupted sleep, and greater exposure to chronic financial stress, which has measurable physiological effects including elevated cortisol, higher blood pressure, and weakened immune function. The connection runs in both directions: financial stress causes health problems, and health problems make financial recovery harder.
What government programs help people earning below the living wage?
The main federal programs include SNAP (food assistance), Medicaid (healthcare for low-income adults and families), CHIP (children’s health insurance), Section 8 housing vouchers, the Earned Income Tax Credit (EITC), LIHEAP (energy assistance), WIC (nutrition for pregnant women and young children), and childcare subsidies through the Child Care and Development Fund. Eligibility thresholds and benefit amounts vary significantly by state and household size. Many eligible workers do not claim all the benefits they qualify for — the 211 helpline and benefits.gov are good starting points for eligibility screening.
How do I know if I’m earning below the living wage for my area?
The MIT Living Wage Calculator on Waldev gives you the precise living wage threshold for your county, household size, and number of workers. You enter your state and county, then select your household type, and the calculator returns the hourly living wage, typical annual living wage, and comparison to minimum wage and the federal poverty level. You can then compare your current hourly or annual income against the threshold to understand the exact size of your gap.
Is it possible to close the gap between my income and the living wage?
Yes, though the realistic path and timeline depend on your situation. The most effective approaches include: negotiating a raise using living wage and market wage data; pursuing short-term credentials with strong wage returns in high-demand fields; accessing all public benefits you qualify for to reduce effective cost of living; relocating to a lower-cost area if your income can transfer; adding income through part-time or freelance work; and protecting credit and building any savings possible to avoid high-cost borrowing. No single strategy works universally, and closing a large gap typically takes sustained effort over one to three years.
Start With Your Specific Number
Every strategy for closing the gap between your income and the living wage starts with knowing how large that gap actually is for your household and county. A single adult in a rural county might have a gap of $3/hour. A single parent with two children in a high-cost metro might have a gap of $20/hour or more. The approaches that make sense depend entirely on the scale of the problem.
The MIT Living Wage Calculator on Waldev is free, takes less than a minute to use, and gives you the county-level, household-specific number you need to make informed decisions about what comes next. It also shows the breakdown of what the living wage assumes about housing, food, healthcare, transportation, and other core expenses — which helps identify which cost categories might offer room to maneuver in your specific situation.
Disclaimer: This article is intended for general educational and informational purposes only. The scenarios, figures, and examples used are illustrative estimates and should not be taken as precise representations of any specific individual’s situation. Living wage thresholds, program eligibility criteria, and benefit amounts vary by location, household size, and year. Program rules change frequently. Readers should consult official government sources, a licensed financial advisor, or a qualified benefits navigator for guidance specific to their situation. Nothing in this article constitutes financial, legal, or benefits advice.