The living wage tells you the minimum you need to survive in your city. But surviving is not the same as living comfortably. This guide explains the three-tier income framework — survival, stability, and thriving — and shows what each level actually looks like in concrete budget terms for different household types and US cities.
In This Article
Jump to any section
Why the Living Wage Is Just the Floor — Not the Finish Line
When most people look up their living wage for the first time, they expect to feel reassured. They run the numbers, see the hourly figure, check it against their salary — and then experience one of two reactions. Either quiet relief that they are above it, or a creeping unease when they realize how high the number is and how little distance they have above it.
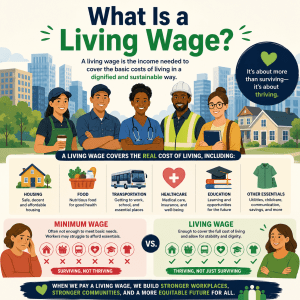
What almost no one feels, after seeing their living wage figure, is that the number describes a comfortable life. That is because it does not. The living wage, as developed by researchers at MIT and widely used as the gold standard for cost-of-living analysis, is an explicitly minimalist calculation. It estimates what a worker needs to cover housing, food, basic transportation, medical care, childcare if applicable, and a thin slice of personal expenses. Nothing more.
There is no savings line in the MIT model. No emergency fund. No retirement contribution. No consumer debt repayment. No restaurant meals, streaming subscriptions, gym memberships, or any of the things most Americans consider part of normal life. The model is built around one question: what is the absolute minimum income needed to meet basic needs without government assistance? And it answers that question precisely — but only that question.
This matters enormously for how you interpret the number. If you are earning exactly your local living wage, you are not doing well. You are covering the essentials. You are one moderately sized unexpected expense away from a genuinely difficult month. You have no financial cushion and no path to building one at that income level. The living wage is the floor of financial viability, not the threshold of financial comfort.
Understanding the distance between the living wage and actual financial comfort — what researchers sometimes call a “stability wage” or “thriving wage” — is the purpose of this guide. Knowing your floor is useful. Knowing how far above the floor you need to climb before money stops being a source of daily stress is arguably more useful.
Before comparing tiers, start with your actual floor. The MIT Living Wage Calculator gives you the county-specific living wage for your household type — single adult, single parent, couple with children, and more. Use that number as your baseline for the analysis in this guide.
The Three-Tier Income Framework: Survival, Stability, and Thriving
Personal finance researchers, labor economists, and household financial planners have long recognized that poverty thresholds and minimum wage levels describe the very bottom of the income ladder — but they tell us almost nothing about what people actually need to feel financially secure. To fill this gap, a three-tier framework has emerged in the literature and in practical financial planning: survival, stability, and thriving.
This framework is not a legal standard or a government benchmark. It is a practical model that acknowledges what the data has consistently shown: that meeting basic needs and having genuine financial security are two very different things, separated by a meaningful income gap that varies by location and household size.
Survival
Basic necessities are covered. Bills are paid in normal months. There is no savings buffer, no emergency fund, and no margin for unexpected costs.
- Housing paid
- Food covered
- Transportation functional
- No savings
- No retirement contributions
- One shock away from hardship
Stability
Essential expenses covered plus a meaningful financial buffer — modest emergency savings, small retirement contributions, and capacity to absorb routine unexpected costs.
- All survival needs met
- Emergency fund building
- Retirement contributions (small)
- Debt repayment possible
- Minor discretionary spending
- Can absorb a $1,000 surprise
Thriving
Financial security is genuine. Long-term goals are being funded. Discretionary spending feels normal. Financial anxiety is not a daily presence.
- All stability needs met
- 3–6 months emergency fund
- Meaningful retirement savings
- Discretionary spending budget
- Debt-free or actively reducing
- Can absorb a $5,000+ surprise
The living wage sits at the bottom edge of Tier 1. Earning it means your essential bills are covered — but only your essential bills. The gap between Tier 1 and Tier 2 (survival to stability) is where most working Americans experience the greatest financial stress. They are technically above the poverty line, often technically above the living wage, but they have no buffer and no path to building one. They are surviving but not stable.
The gap between Tier 2 and Tier 3 (stability to thriving) is a different kind of transition. It is less about avoiding hardship and more about building genuine financial freedom. People in Tier 2 feel relatively secure day to day but may still experience anxiety about retirement, large purchases, or long-term financial goals. Tier 3 is where that anxiety meaningfully diminishes.
Important framing: These tiers are not about luxury versus necessity. Tier 3 — thriving — does not mean wealthy. It means financially stable and building toward long-term security. For most households, thriving still means careful budgeting and deliberate spending. It simply means the fundamentals are solid enough that money is not a source of constant anxiety.
What Each Tier Actually Covers — Category by Category
The clearest way to understand the three tiers is not through income thresholds but through what each tier does and does not include in a monthly household budget. The following breakdown is written for a single adult in a mid-cost US city. The specific dollar amounts will vary by location — use the calculator to find your local figures — but the category-level structure holds across most markets.
| Budget Category | 🟠 Tier 1 — Survival | 🟢 Tier 2 — Stability | 🔵 Tier 3 — Thriving |
|---|---|---|---|
| Housing | Basic market-rate rent; often 40–50% of income | Same or similar; 30–35% of income target | 30% or below; may own or save for down payment |
| Food | All groceries, basic cooking; no restaurants | Groceries plus occasional dining out | Full grocery budget plus regular dining budget |
| Transportation | Basic commute costs (bus pass or older car) | Reliable vehicle or transit plus some flexibility | Reliable transportation and some travel budget |
| Healthcare | Basic insurance premium only; high deductible | Insurance plus modest out-of-pocket reserve | Good coverage with HSA contributions |
| Emergency savings | None; not in the budget | $50–$200/month building toward $1,000–$3,000 | $300–$600/month building toward 3–6 months expenses |
| Retirement | Not included | 3–5% of income where employer match available | 10–15% of income across accounts |
| Consumer debt | Minimum payments only | Minimum plus extra toward principal | Active payoff strategy; minimal new debt |
| Discretionary spending | Minimal — haircuts, basic personal care only | Small entertainment budget; some flexibility | Meaningful leisure, travel, and hobby budget |
| Childcare (if applicable) | Required childcare only; often takes 20–35% of income | Required childcare; slight breathing room | Full childcare needs met; saving for education |
| Income buffer / margin | None; budget is at 100% or above each month | 5–10% monthly surplus most months | 15–25%+ monthly surplus, consistently invested |
The sharpest way to read this table is to look at the rows for emergency savings and retirement. At Tier 1 — survival level — neither exists. They are not part of the budget because the income does not allow for them. This is the defining structural difference between the living wage and a genuinely comfortable income. You can cover your bills. You cannot build any kind of financial future from that position.
The move from Tier 1 to Tier 2 is therefore not about comfort in the conventional sense. It is about acquiring the most basic form of financial resilience: a small cash buffer and the beginnings of retirement savings. Without those two things, a household is perpetually one event away from crisis, even if the bills are technically paid.
Approximate Tier Thresholds by Household Type
Translating the three tiers into income numbers requires anchoring to a local living wage figure first. The thresholds below are expressed as multipliers of the living wage rather than fixed dollar amounts, because the living wage itself varies significantly by county. For any household type, the pattern holds regardless of geography: stability begins meaningfully above the survival floor, and thriving is well above that.
Illustrative figures only. The income multipliers and dollar examples below are general reference points based on budget modelling principles. Your actual stability and thriving thresholds depend on your specific county’s living wage, your household’s actual expenses, existing debt, and local market conditions. Run your local living wage figure first and use that as your personal baseline.
| Household Type | Tier 1 — Survival | Tier 2 — Stability (est.) | Tier 3 — Thriving (est.) | Multiplier to Stability |
|---|---|---|---|---|
| Single adult, no children | ~$21/hr (living wage baseline) | ~$26–$30/hr | ~$38–$50/hr | ~1.25–1.45× |
| Single adult, one child | ~$36–$40/hr (childcare drives this up sharply) | ~$44–$50/hr | ~$58–$72/hr | ~1.22–1.30× |
| Two adults, no children (dual income) | ~$18–$20/hr per adult | ~$22–$26/hr per adult | ~$30–$40/hr per adult | ~1.20–1.30× |
| Two adults, two children (dual income) | ~$23–$27/hr per adult | ~$30–$36/hr per adult | ~$42–$55/hr per adult | ~1.25–1.35× |
| Single adult, two children | ~$45–$52/hr (highest childcare burden) | ~$56–$64/hr | ~$72–$88/hr | ~1.22–1.25× |
A few patterns are worth noting across all household types. First, the multiplier from survival to stability is relatively consistent — roughly 1.2 to 1.45 times the living wage — but the absolute dollar difference grows sharply as the household’s living wage itself is higher. A single adult needs to earn roughly $5–$9 more per hour to reach stability. A single parent with two children may need to earn $11–$12 more per hour.
Second, the gap from stability to thriving is considerably larger than the gap from survival to stability. This is because thriving requires not just a buffer but active, meaningful progress toward long-term financial goals: funded retirement accounts, a growing emergency reserve, manageable or eliminated debt. These things require sustained monthly surplus, and surplus requires income meaningfully above the stability threshold.
Third, and most importantly: these are pre-tax income figures. Your actual take-home pay, after federal and state income taxes and payroll deductions, may be 20–30% lower than the gross figures above. The tier targets need to account for your effective tax rate, not just the gross hourly or salary figure.
The multipliers above only work if you start with your actual local living wage. Use the free living wage calculator to find your county’s figure for your exact household type, then apply the multipliers to estimate your personal stability and thriving targets.
How the Tiers Shift by City: The Same Salary Means Something Different Everywhere
One of the most important — and most consistently misunderstood — aspects of the living wage and the three-tier framework is how dramatically geography affects where any given salary lands on the spectrum. A salary that places someone solidly in Tier 3 in rural Ohio might not reach Tier 1 in San Francisco. This is not a metaphor. It is arithmetic.
The following table shows approximate tier threshold examples for a single adult in six representative US cities. These are illustrative reference figures based on typical living wage estimates for those metro areas — your actual county figure will vary. See the city-by-city comparison guide for deeper location-specific analysis.
| City | Single Adult Living Wage (Approx.) | Stability Threshold (Approx.) | Thriving Threshold (Approx.) | Annual Salary to Thrive |
|---|---|---|---|---|
| San Francisco, CA | ~$28–$32/hr | ~$38–$44/hr | ~$54–$65/hr | $112,000–$135,000 |
| New York City, NY | ~$26–$30/hr | ~$35–$42/hr | ~$50–$60/hr | $104,000–$125,000 |
| Chicago, IL | ~$20–$24/hr | ~$26–$32/hr | ~$38–$48/hr | $79,000–$100,000 |
| Austin, TX | ~$20–$23/hr | ~$26–$30/hr | ~$37–$46/hr | $77,000–$96,000 |
| Columbus, OH | ~$17–$20/hr | ~$22–$26/hr | ~$30–$38/hr | $62,000–$79,000 |
| Rural Mississippi | ~$14–$17/hr | ~$18–$22/hr | ~$24–$30/hr | $50,000–$62,000 |
The column that deserves the most attention is the final one: annual salary to thrive. Notice that in San Francisco, reaching Tier 3 as a single adult requires a salary above $110,000 — a figure most people would consider quite high. In rural Mississippi, the same Tier 3 status requires roughly $50,000–$62,000, which many Americans would consider a modest middle-class income.
This has profound implications for salary decisions, relocation choices, and job comparisons. A remote job paying $85,000 might put you firmly in Tier 3 in Columbus but leave you in Tier 1 in San Francisco. A salary increase from $65,000 to $80,000 might move you from Tier 1 to Tier 2 in Austin, but represent no tier change at all in New York City.
The Six-Figure Illusion
One of the most persistent misconceptions about the comfortable income threshold is the cultural belief that a six-figure salary — $100,000 per year — represents financial comfort in America. In lower-cost regions, this is broadly true. But in the country’s most expensive cities, $100,000 can leave a household in Tier 1 or barely into Tier 2.
A single parent earning $100,000 gross in New York City, after federal and state taxes, healthcare premiums, and childcare, may have take-home resources that align more closely with the survival tier than with genuine comfort. The six-figure threshold has psychological weight — it feels like a lot — but the living wage data makes clear that the numbers that matter are local, not national.
Real-World Scenarios: What Each Tier Looks Like in Practice
The tiers become far more concrete when you walk through specific household examples. The following scenarios are illustrative — names and details are fictional, but the income and budget dynamics reflect real patterns from household budget research across different US cities and household types.
Marcus — Single Adult, Midsize City
Marcus is 28 and works full-time as a warehouse associate in Columbus, Ohio. He earns $19 per hour, which amounts to about $39,520 per year before taxes. His take-home after taxes and health insurance premiums is approximately $2,640 per month.
His rent is $1,050 per month — a shared apartment in a mid-range neighborhood. After rent, groceries ($320), car insurance and gas ($310), and his health plan premium ($110), Marcus has roughly $850 left. That covers his phone, utilities, basic clothing, and the occasional necessity. Most months, his budget is at 98–100% of his income. There is no savings contribution, no emergency fund, and no retirement account.
Marcus is above the local living wage for a single adult in his county — which is approximately $18.50 per hour. He is technically in Tier 1. But the $0.50 margin above the floor means nothing practically. He is one car repair or one medical bill from a genuinely difficult situation. His living wage is met. His financial stability is not.
What would move Marcus to Tier 2? An income around $24–$27 per hour would give him enough monthly surplus — roughly $400–$600 — to start building a small emergency fund and contribute a few percent to a 401(k). That transition requires either a raise, a job change, additional income, or a significant reduction in fixed costs like housing.
Diana — Single Mother, One Child, Urban Market
Diana is 34 and works as an administrative coordinator in Chicago. She earns $44,000 per year, which is roughly $21 per hour. Her take-home after taxes is approximately $2,940 per month.
Her rent for a two-bedroom apartment is $1,480 per month — the lowest price she found in a neighborhood with an acceptable commute to her son’s daycare. Childcare costs $1,120 per month for her four-year-old. That is $2,600 in fixed costs before food, transportation, insurance, or anything else. Diana’s remaining budget is $340 per month for all other expenses.
Diana is technically at the living wage for a single parent in her county — the MIT model places that figure at approximately $37–$42 per hour in the Chicago metro area, and Diana earns $21. She is, in fact, below the living wage for her household type, despite earning $44,000 annually. She qualifies for a childcare subsidy that partially offsets her costs, which is the only reason the budget works at all in most months. She is in Tier 1, but a subsidy reduction or rent increase would push her below it.
What would move Diana to Tier 2? An income in the $52,000–$58,000 range would give her enough post-subsidy breathing room to contribute to an emergency fund and begin small retirement savings. The threshold is high because childcare costs consume such a large fraction of her income — an issue that persists until her son enters public school, which represents a major income-equivalent shift.
Kevin and Priya — Dual Income, No Children, High-Cost City
Kevin and Priya both work in Austin, Texas. Kevin earns $58,000 as a project manager; Priya earns $52,000 as a graphic designer. Combined gross income is $110,000, or approximately $52/hr combined between two full-time workers.
Their combined take-home after taxes is approximately $6,900 per month. Rent for a two-bedroom apartment is $1,880. Groceries, transportation, and insurance run to approximately $1,700. Their remaining $3,320 covers utilities, entertainment, streaming, dining out twice a week, and — critically — $600 per month to a joint emergency fund and $500 per month combined to 401(k) accounts (with partial employer match).
Kevin and Priya are comfortably in Tier 2. They have a growing emergency fund, they are building retirement savings, they have a small but real discretionary budget, and most months end with a small surplus. They do not feel rich. They feel financially stable, which is a meaningfully different thing. A $2,000 car repair would sting but would not derail their finances. They can plan a modest vacation without going into debt.
What would move them to Tier 3? An additional $20,000–$30,000 in combined income — say, one promotion or a job change — would give them the surplus to max out retirement contributions, aggressively pay down student loans, and build toward a home down payment. They are close to the Tier 3 threshold in Austin, but a move to a high-cost city like San Francisco at the same income would push them back toward Tier 1.
Sandra — Single Adult, Rural Low-Cost County
Sandra is 41 and works remotely as a software developer for a company headquartered in a major city. She earns $92,000 per year from a rural county in Tennessee where the living wage for a single adult is approximately $15.50 per hour, or roughly $32,000 annually.
Sandra’s take-home is approximately $5,600 per month. Her rent is $820 for a three-bedroom house. Her total essential expenses — food, car, insurance, utilities, internet — run to approximately $1,800 per month. She contributes $1,400 per month to retirement accounts, $400 to an emergency fund (now fully funded at six months of expenses), and has a $1,200 monthly discretionary budget she uses for travel, fitness, and hobbies.
Sandra is in Tier 3. Not because she is unusually highly paid by national standards, but because her income-to-local-cost ratio is favorable in a way it would not be if she lived in the city her employer is based in. This is the geographic dimension of the tier framework in its clearest form. The same $92,000 would place her solidly in Tier 1 in San Francisco.
The High-Earner Trap — Lifestyle Inflation and the Invisible Tier Slide
Not all households in Tier 1 or Tier 2 are there because of low income. Some high earners find themselves in Tier 1 — or even below the living wage threshold in terms of actual financial resilience — because of lifestyle inflation, high consumer debt servicing, and poor savings habits.
Consider a household earning $180,000 in a high-cost city with $4,200 in monthly debt payments (student loans, car loans, credit cards), a $3,800 rent, and minimal savings. After debt service, housing, taxes, and living expenses, this household may have a financial buffer that looks more like Tier 1 than Tier 3 — despite an income that would comfortably place them in Tier 3 in most of the country.
The tier framework is not solely an income framework. It is a financial resilience framework. Tier 2 requires not just that you earn enough to save but that you actually save. Tier 3 requires not just a high salary but a sustainable relationship between income, expenses, and long-term financial commitments. Income is necessary but not sufficient for any tier above survival.
Moving Between Tiers: What Actually Changes at Each Transition
Understanding where you are is the first step. Understanding how to move is the second. The three tier transitions — from survival to stability, and from stability to thriving — require different things, and it is worth being clear about what each transition actually demands.
This is the most impactful transition in the framework — and the hardest for many households. Moving from survival to stability requires generating consistent monthly surplus, typically in the $300–$600 range for a single adult. That surplus is then used to build an emergency fund (the first $1,000–$3,000 is the highest-value saving you can do) and begin even small retirement contributions. The income increase required varies by location but is typically in the range of 20–40% above the living wage. The transition can also be achieved through expense reduction — reducing housing costs by moving, eliminating a car payment, or addressing high-interest debt — without a salary increase.
Moving from stability to thriving is less about crisis prevention and more about building genuine financial freedom. It requires enough consistent surplus to max out (or meaningfully contribute to) retirement accounts, eliminate consumer debt, build toward major goals like homeownership or education funding, and establish a discretionary budget that does not generate anxiety. This transition is typically achieved through career advancement, negotiation, or significant relocation to a lower-cost market. It often unfolds over years rather than in a single step.
The transitions are not one-directional. Household changes — a new child, a partner leaving the workforce, a rent increase, job loss, a major health event, or a move to a higher-cost city — can push a household down one or more tiers. Someone comfortably in Tier 3 in Austin may find themselves back in Tier 2 after having a second child, or in Tier 1 after accepting a role in Manhattan without a proportionate salary increase. The living wage figure to use as your floor shifts with your household composition and geography.
A salary comparison at face value misses the substantial value of employer benefits. A job offering $60,000 with full health coverage, employer-matched retirement contributions, and paid parental leave may place a household firmly in Tier 2. The same salary with no benefits and high out-of-pocket healthcare costs may leave the household in Tier 1. When evaluating tier placement, the total compensation package — including the monetized value of benefits — matters as much as the nominal salary figure. The living wage calculator uses after-cost figures; factor in what benefits replace when making salary comparisons.
What Employers and Job Seekers Both Miss When Comparing Salaries
The three-tier framework has direct practical implications for salary negotiations and job offer evaluations — implications that tend to be underused on both sides of the table.
What Job Seekers Tend to Miss
Most job seekers evaluate salary offers against one of three benchmarks: what they currently earn, what others in similar roles earn (market rate), or a round-number aspiration (“I want six figures”). Very few evaluate a job offer against the question: “Does this salary place me in Tier 2 or Tier 3 for my household type in this city?”
That question reframes the entire evaluation. An offer of $72,000 in a mid-cost city for a single adult is a Tier 3 outcome — genuinely comfortable, with real savings potential. The same $72,000 in San Francisco for a single parent with two children is well below the living wage for that household type, placing the earner not even at Tier 1. The benchmark that matters is not the nominal number but the number’s relationship to local costs for your specific household.
Before accepting any job offer, it is worth checking the offer against your county’s living wage for your household type, then applying the stability and thriving multipliers. Use the self-assessment guide as a framework for that evaluation.
What Employers Tend to Miss
Employers who set compensation at the living wage — and frame that as a responsible baseline — are technically accurate but practically misleading. Paying the living wage means employees are surviving, not stable. The research on financial stress and workplace performance is consistent: workers in Tier 1 experience higher anxiety, more absenteeism related to financial crises, lower engagement, and higher turnover than workers in Tier 2 or Tier 3. Paying the living wage avoids exploitation. Paying the stability wage builds a workforce with lower turnover and higher productivity.
For employers, the relevant benchmark is not just “are we paying above the living wage” but “are we paying enough that our employees have a real financial buffer — that they are stable, not just surviving.” That is a different — and higher — threshold, but one with meaningful return on investment in the form of retention and performance.
For Job Seekers: Questions to Ask
What is the living wage for my household type in this city? Where does this offer sit on the survival-stability-thriving spectrum? Does this offer give me a realistic path to building an emergency fund within 12 months? Does the total compensation package — including benefits — change the tier calculation?
For Employers: Questions to Ask
Are our starting wages at or above the stability threshold for a single adult in our county? What is the annualized cost of turnover versus the cost of a stability-level wage increase? Are we tracking whether employees at the bottom of our pay bands are surviving or stable?
Common Financial Traps at Each Tier
Each tier carries its own set of characteristic financial mistakes — patterns that tend to keep people stuck at a tier below where their income should theoretically place them. Recognizing these traps is as important as knowing which tier you are in.
🟠 Tier 1 Trap: The “I’ll save when I earn more” delay
The most dangerous trap at the survival tier is deferring any savings until a future, higher income level. The problem is compounding. Even small savings — $25 or $50 a month — build the habit and the emergency fund that protects Tier 1 households from the debt spiral that a single unexpected expense can trigger. Waiting for a raise to start saving almost always results in no saving at higher incomes either, because lifestyle adjustments consume the additional income. Starting with even a symbolic amount at Tier 1 matters.
🟠 Tier 1 Trap: High-interest consumer debt that amplifies the shortfall
Many households at or near the living wage carry consumer debt — credit cards, high-interest personal loans, or payday loans used to cover emergencies that their non-existent emergency fund could not. The interest on these debts can add hundreds of dollars per month to effective living costs, deepening the gap between income and actual financial stability. Addressing high-interest debt is often the highest-return financial action available at Tier 1, even ahead of retirement savings.
🟢 Tier 2 Trap: Emergency fund complacency
Households that have successfully built a small emergency fund — say, $1,000 to $3,000 — often stop saving there and redirect the surplus into discretionary spending. The financial research is clear that a one-month emergency fund is not protection; it is a minor buffer. The stability tier requires building toward three to six months of essential expenses as a reserve. Stopping at $1,000 and spending the rest leaves households vulnerable to moderate-severity events that a fuller emergency fund would absorb without going into debt.
🟢 Tier 2 Trap: Lifestyle inflation as income rises
The transition from Tier 1 to Tier 2 often coincides with a meaningful raise or job change. The trap is spending the entire increase rather than allocating a substantial portion to savings, retirement, and debt reduction. Moving from Tier 1 to Tier 2 requires surplus — and surplus requires discipline at the point of income increase, which is paradoxically also the moment when spending the increase feels most natural and deserved.
🔵 Tier 3 Trap: Assuming thriving is permanent
Households that reach Tier 3 sometimes treat the tier as a fixed achievement rather than a dynamic equilibrium that requires active maintenance. A second child, a move to a higher-cost city, a partner leaving the workforce, or taking on a large mortgage relative to income can push a Tier 3 household back toward Tier 2 or even Tier 1. The tier framework is a snapshot that changes with life circumstances — regular reassessment is part of maintaining the position.
For a detailed breakdown of how money flows at the survival level — and what is conspicuously absent from that budget — read the companion guide on what a living wage budget actually looks like. It builds three full monthly budgets so you can see exactly where the money goes and what it does not cover.
Reference Sources
The Living Wage Calculator developed by Dr. Amy K. Glasmeier provides county-level living wage estimates for all US counties, updated annually to reflect current cost data.
EPI’s Family Budget Calculator expands on the living wage model to include savings and other costs, providing a research basis for stability-tier estimates.
Urban Institute research on financial health and household resilience provides the evidence base for the relationship between income tiers and financial stress outcomes.
BLS Consumer Expenditure Survey data is used to calibrate average household spending across categories for different income levels and household types.
Frequently Asked Questions
What is the difference between a living wage and a comfortable income?
A living wage covers only the essentials — housing, food, transportation, healthcare, and childcare if applicable. There is no savings budget, no emergency fund, and no retirement contribution included. A comfortable income — what the three-tier framework calls the stability or thriving wage — goes well beyond that. It provides a financial buffer for unexpected costs, meaningful retirement savings, and at higher levels, genuine discretionary spending without anxiety. The gap between the two can be 30–80% of the living wage figure, depending on location and household type.
How much above the living wage do I need to earn to feel financially stable?
For most single adults in mid-cost US cities, the stability threshold sits roughly 25–40% above the local living wage. That additional income — when directed consistently toward savings and debt reduction rather than spending — provides the financial buffer that distinguishes stability from survival. The gap is larger in absolute terms in high-cost cities and for households with children, because childcare and housing costs push both the living wage and the stability threshold up significantly.
What is a thriving wage?
A thriving wage is the income level at which a household moves beyond financial stability into genuine financial freedom — where retirement savings are meaningful, the emergency fund is fully funded at three to six months of expenses, consumer debt is being actively reduced or eliminated, and discretionary spending does not generate financial anxiety. It typically sits 60–120% above the local living wage, though the exact threshold is geography- and household-specific. Thriving is not wealthy. It is the point at which money stops being a source of daily stress and becomes a tool for building the future you want.
Why does the living wage not include savings?
The MIT Living Wage Model was designed to answer one specific question: what is the minimum income a household needs to cover basic necessities without government assistance? It deliberately excludes anything above that floor, including retirement savings, emergency funds, and debt repayment. This makes the model useful as a policy baseline and a benchmark for evaluating whether wages are adequate for survival — but it also means the living wage should not be confused with a financially healthy income level. It is the floor, not the target.
Is a six-figure income always comfortable?
No. In high-cost cities — San Francisco, New York, Boston, Seattle — a single parent earning $100,000 may be at or near the survival-stability threshold, not the thriving tier, particularly after taxes, childcare, and housing. The tier you occupy is determined by the relationship between your income and your local cost of living, not by the nominal salary number. Six figures in rural Tennessee is solidly Tier 3. Six figures in Manhattan may be Tier 1 for some household configurations.
What does the survival-stability-thriving framework mean in practice?
Survival means your bills are covered in normal months but there is no buffer for anything unexpected. Stability means you cover essentials, have a growing emergency fund, and contribute something — even a small amount — to retirement. Thriving means you have real financial freedom: a full emergency fund, meaningful retirement savings, manageable or no consumer debt, and enough discretionary margin that spending decisions are not a source of constant anxiety. Most people can place themselves in one of these tiers fairly quickly, and the framework gives a concrete income target to work toward rather than a vague aspiration of “earning more.”
How do I find out what my local living wage is?
The MIT Living Wage Calculator provides county-specific living wage estimates for every US county, broken down by household type — single adult, single parent, couples with and without children, and multi-adult households. You can use the free living wage calculator on Waldev to look up your specific figure. Once you have that baseline, applying the stability and thriving multipliers from this article gives you a personalized income roadmap rather than a national average that may not reflect your actual location.
Know Your Floor. Then Aim Higher.
The living wage tells you the minimum you need to survive. The three-tier framework tells you what you need to thrive. Start with the calculator — find your local floor, then use this guide to set a real income target.
Use the Free Living Wage Calculator →Related Guides in This Series
📘 What Is a Living Wage?
A plain-language introduction to how the living wage is defined, calculated, and why it matters for your household.
Read the guide →🏙️ Living Wage by City
See how the living wage — and the comfort gap above it — varies across major US cities, with real context for what the numbers mean.
Explore city comparisons →✅ Am I Earning a Living Wage?
A personal self-assessment guide to compare your income against your county’s living wage and understand what the result means.
Take the self-assessment →💰 What Does a Living Wage Budget Look Like?
Three detailed monthly budgets built at living wage level for different household types — see exactly where the money goes and what isn’t in the budget.
See the budget breakdown →Disclaimer: The income thresholds, tier multipliers, and budget figures in this article are illustrative reference points intended to help readers understand the concept of income tiers relative to the living wage. They are not financial advice and should not be used as the sole basis for financial planning decisions. Actual stability and thriving thresholds vary significantly based on individual circumstances, local cost of living, household composition, existing debt, employer benefits, and tax situations. For county-specific living wage data, use the MIT Living Wage Calculator. For personalized financial guidance, consult a qualified financial adviser.