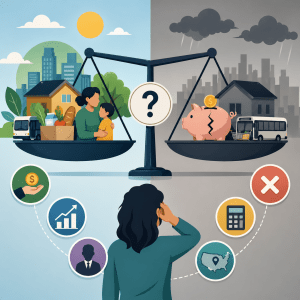
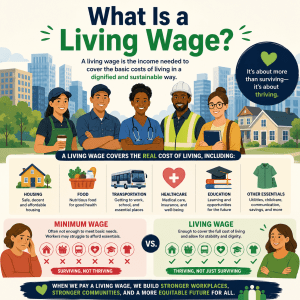
These two benchmarks are often mentioned in the same breath — poverty line here, living wage there — as though they measure similar things. They do not. The federal poverty line is a relic of 1960s food economics, updated annually for inflation but never fundamentally redesigned. The living wage is built from what things actually cost right now, in specific places, for specific households. Understanding why they diverge so sharply — sometimes by a factor of three — changes how you read any conversation about poverty, wages, or income adequacy in America.
What This Article Covers
Jump to any section using the links below.
What Each Number Actually Is
Before the comparison can be meaningful, it helps to have a precise definition of each term — not the vague impressions most people carry around, but what each number is actually designed to measure and how it is calculated.
A government-defined income threshold for program eligibility
- Set by the U.S. Department of Health and Human Services annually
- Originally calculated in the 1960s from food cost data
- Updated each year using the Consumer Price Index for inflation
- Applied nearly uniformly across the continental United States
- Used to determine eligibility for Medicaid, SNAP, CHIP, and other programs
- Does not vary by county, city, or local cost of living
- Represents a legal and administrative threshold, not a cost-of-living estimate
A research-based estimate of income needed for basic self-sufficiency
- Calculated by MIT researchers (Dr. Amy Glasmeier et al.) from actual local costs
- Updated regularly with current market data for each county
- Varies by county — sometimes by $10–$15/hour between locations
- Calculated separately for different household types and sizes
- Not used for government program eligibility — it is a research benchmark
- Reflects current housing costs, childcare, healthcare, and transportation
- Represents the income a worker needs to avoid relying on assistance
The key distinction is purpose. The poverty line is an administrative tool — a line drawn in legislation and policy to determine who gets what. The living wage is an analytical tool — a calculation of what it actually costs to live. These are not the same goal, and the numbers they produce reflect that difference clearly.
How the Federal Poverty Line Was Created — and Why It Still Uses That Formula
To understand why the poverty line is so different from the living wage, you need to understand where it came from. The story is specific, and it explains a great deal about why a benchmark designed in 1963 still governs how the federal government measures poverty today.
The USDA food survey that started everything
The U.S. Department of Agriculture published a survey of American household spending. One finding stood out: the average American family spent roughly one-third of its income on food. This observation — a snapshot of spending patterns in mid-1950s America — became the foundation of the poverty line formula.
Mollie Orshansky’s calculation
Social Security Administration economist Mollie Orshansky took the USDA’s “economy food plan” — the minimum cost of a nutritionally adequate diet — and multiplied it by three, based on the one-third spending ratio from the 1955 survey. The result was the first federal poverty threshold. It was a practical estimate for a specific administrative purpose, not a comprehensive cost-of-living calculation. Orshansky herself acknowledged its limitations as a permanent benchmark.
Adoption as official policy
The Nixon administration formally adopted the Orshansky thresholds as the official federal poverty measure. At this point the formula became embedded in policy — used to determine eligibility for the expanding set of federal assistance programs being built out through the War on Poverty era. Once entrenched in legislation, it became extremely difficult to replace.
Annual inflation adjustment — no structural change
Since 1969, the poverty line has been updated annually using the Consumer Price Index to account for general inflation. The underlying formula — food cost multiplied by three — has never been changed. The basket of goods used to estimate the minimum food budget was updated in 1981 and has been periodically revised, but the structural logic of the calculation remains identical to Orshansky’s 1963 methodology. Decades of economists and poverty researchers have argued for replacement. The formula has not been replaced.
💡 Why hasn’t it changed? The primary reason the poverty line formula has not been replaced is political. Any revised formula that more accurately captured modern living costs would, by definition, show a higher poverty rate — more people classified as poor. That political implication has made comprehensive reform consistently difficult to advance through Congress, regardless of which party controls it.
Why the Formula No Longer Reflects Modern Living Costs
The core problem with the poverty line formula is not that it was bad in 1963. For its time and purpose, it was a reasonable approximation. The problem is that the structure of American household spending has changed dramatically in the six decades since — and the formula has not changed with it.
The food-to-income ratio has collapsed
When Orshansky multiplied food costs by three, she was capturing the fact that food represented roughly one-third of the average American household’s budget. Today, food represents closer to one-eighth to one-tenth of the average household’s spending. If you applied the same multiplier logic to today’s food spending, you would need to multiply by eight or ten to capture total household costs — not three.
The formula’s answer to this problem is to use the CPI to inflate the thresholds over time. But the CPI measures average price changes across a basket of goods and services. It does not capture the fact that some categories — particularly housing, healthcare, and childcare — have inflated far faster than the general price level, while food has inflated more slowly. A formula that started from food costs and used a general inflation multiplier will systematically undercount the households whose budgets are now dominated by housing, healthcare, and childcare rather than food.
Three categories the formula cannot see
🏠 Housing
In 1963, housing was a more modest share of household budgets in most of the country. Since then, housing costs — particularly in urban and coastal areas — have grown dramatically relative to income growth. The poverty line formula does not account for regional housing cost variation. A single number applies whether you rent in rural Mississippi or San Francisco.
👶 Childcare
In 1963, large-scale commercial childcare barely existed. Most mothers of young children did not work outside the home. The concept of a working single parent paying $1,500/month for center-based infant care simply was not part of the economic landscape the formula was designed to capture. The poverty line has no meaningful childcare component.
🏥 Healthcare
Healthcare costs in 1963 were a fraction of what they are today as a share of household budgets. The growth of employer-sponsored insurance, high-deductible plans, and uninsured healthcare costs over the following six decades created a cost burden that the original food-cost formula has no mechanism to capture proportionally.
⚠️ The practical consequence: Because the poverty line misses these three large cost categories, it systematically undercounts the number of Americans experiencing genuine material hardship. Research consistently shows that many families officially classified as “not in poverty” cannot actually afford the basics their daily lives require without going into debt or relying on assistance. The poverty line counts them as fine. The living wage calculation does not.
How the Living Wage Was Developed — A Different Methodology Entirely
The living wage is built from a fundamentally different methodological premise. Rather than starting from food costs and multiplying up, the MIT Living Wage Calculator starts from the actual current cost of each major necessity and adds them together — housing, food, transportation, healthcare, childcare, and personal care basics, plus the taxes that must be paid on the gross income required to cover them.
Because it starts from real local market costs rather than a national formula, the living wage can capture something the poverty line cannot: the actual geographic variation in what it costs to live. A one-bedroom apartment in rural Tennessee renting for $700/month and a comparable apartment in San Francisco at $3,000/month represent genuinely different income requirements. The living wage reflects that. The poverty line does not.
The approach also updates differently. When local rents rise, the living wage for that county rises. When childcare costs spike in a particular metro, the living wage for affected households in that area rises. The model is not just inflation-adjusted — it tracks actual changes in specific cost categories at the local level. That responsiveness is one of its most significant analytical advantages over the static poverty line formula.
The MIT Living Wage Calculator on Waldev shows both the living wage figure and the cost breakdown behind it — housing, food, healthcare, childcare, and transportation — for your specific county and household type.
The Gap Between the Two Numbers
The difference between the federal poverty line and the living wage is not a rounding error or a methodological nuance. In most U.S. counties, they tell fundamentally different stories about whether a given income is adequate. Here is what the gap looks like in concrete terms.
Approximate federal poverty guideline for a single adult in 2024 (continental U.S.)
Approximate range of living wages for a single adult across U.S. counties (low-cost to high-cost)
Typical ratio of the single-adult living wage to the poverty line, varying by county cost level
Annual income comparison — illustrative, single adult
Illustrative estimates. Poverty line figure based on 2024 HHS guidelines. Living wage figures based on MIT methodology for representative county types. Actual figures vary by county and household type.
For a family of four, the disparity is even more pronounced. The federal poverty guideline for a family of four sits around $31,000. The living wage for two adults and two children — both adults working — in a mid-cost county commonly runs $55,000–$75,000 combined. In a high-cost city it can exceed $100,000. The poverty line says the family of four earning $32,000 is not in poverty. The living wage says they need roughly twice that income to cover basic necessities without outside help.
The Working Poor — Above the Poverty Line, Below the Living Wage
The most important practical consequence of the gap between these two benchmarks is the large population that falls in between them — people who earn above the federal poverty line and are therefore officially classified as “not in poverty,” but who earn below the living wage for their location and household type and are therefore unable to cover their basic expenses without assistance or debt.
This is not a small or marginal population. Research consistently finds that tens of millions of American workers fall into this middle zone — officially above poverty, practically unable to make ends meet. They are above the eligibility threshold for some assistance programs but unable to afford the things those programs are designed to help with. They are counted as economically stable by official statistics but experiencing real material hardship in their daily lives.
How the zone works in practice
Imagine a single mother in a mid-cost city earning $28,000 per year. The federal poverty guideline for a family of two (one adult, one child) might be around $20,000. She is above the poverty line — by $8,000. She does not count as poor in official statistics. She may be ineligible for some assistance programs because her income exceeds the threshold.
The living wage for a single parent with one child in her county, however, is roughly $70,000 per year. She is $42,000 below the living wage. She cannot cover her childcare, rent, healthcare, food, and transportation without some combination of assistance, debt, or going without essentials. The poverty line says she is fine. The living wage says she is not.
Working full-time does not guarantee living wage income. Many full-time workers in retail, food service, home care, childcare, and logistics earn above the federal minimum wage — and therefore above the poverty line — but below the living wage for their county. Being employed full-time and financially struggling are not mutually exclusive. The working poor are, by definition, people for whom full-time work does not produce income sufficient for their basic needs.
The gap is widest for households with children. The poverty line does increase with family size, but not at the same rate as the living wage — because the living wage accounts for the enormous cost of childcare, which the poverty line formula does not meaningfully capture. Single parents and one-income families with children face the largest gap between their official poverty status and their practical financial reality.
Urban workers are disproportionately affected. The poverty line’s geographic blindness means it classifies someone earning $25,000 in rural Mississippi the same way as someone earning $25,000 in San Francisco. Both are above the poverty line. The former may be genuinely adequate. The latter is dramatically below what city life requires. Workers in high-cost metros are consistently undercounted as struggling by the official poverty measure.
The Geographic Blindness of the Poverty Line
If there is one single design failure of the federal poverty line that causes the most real-world harm, it is geographic uniformity. The poverty line applies essentially the same income threshold across the entire continental United States — with only a modest upward adjustment for Alaska and Hawaii. This means a household in rural West Virginia and a household in Manhattan are evaluated against the same income threshold, despite facing dramatically different costs of living.
The living wage, by contrast, is calculated at the county level. It reflects the actual median rent in each county, the actual childcare market rates, the actual local healthcare costs. The contrast in approach produces wildly different pictures of who is struggling and where.
| Location | Federal poverty line (single adult, ~2024) |
Living wage estimate (single adult) |
What the poverty line misses |
|---|---|---|---|
| Rural Mississippi county | ~$15,600/yr | ~$29,000–$33,000/yr | Living wage is still roughly 2× the poverty line even in one of the lowest-cost areas in the country |
| Mid-size Midwest city | ~$15,600/yr | ~$38,000–$44,000/yr | Gap widens; poverty line unchanged while housing and childcare costs are notably higher |
| Major Sun Belt metro | ~$15,600/yr | ~$42,000–$50,000/yr | Post-2020 rent surge has widened gap significantly; poverty line does not reflect this |
| High-cost coastal city | ~$15,600/yr | ~$58,000–$70,000/yr | Poverty line classifies someone earning $20,000 as not poor; living wage says they need 3–4× that income |
Living wage figures are illustrative estimates based on MIT methodology for representative county types. For precise county figures, use the MIT Living Wage Calculator.
The uniform poverty line creates a specific distortion in policy and public understanding. It understates hardship in high-cost areas — where many workers earning twice the poverty line are still genuinely struggling — and it overstates the adequacy threshold in low-cost areas where the poverty line is closer to (though still below) actual living costs. Neither exaggeration serves good policy making.
The Supplemental Poverty Measure — A Better Official Alternative
Aware of the limitations of the official poverty line, the U.S. Census Bureau and Bureau of Labor Statistics developed an alternative measure: the Supplemental Poverty Measure, or SPM. It was first published in 2011 and is now released annually alongside the official poverty data.
The SPM does not replace the official poverty line for program eligibility purposes — Medicaid, SNAP, and other assistance programs still use the traditional measure. But it provides a more analytically accurate picture of material hardship, and researchers and policymakers increasingly treat it as a more credible indicator of who is actually struggling.
How the SPM differs from the official measure
- Uses a threshold based on actual spending patterns for food, clothing, shelter, and utilities — not a food-only formula
- Adjusts for geographic cost differences, including housing costs in different metro areas
- Counts non-cash benefits (SNAP, housing subsidies, school meals) as income
- Deducts necessary expenses: taxes, childcare costs, out-of-pocket medical expenses
- Produces thresholds that vary by family type and location more sensitively than the official measure
What the SPM reveals that the official measure hides
- Higher poverty rates in expensive coastal metros than the official measure shows
- Lower poverty rates in some lower-cost areas once non-cash benefits are counted
- The significant role of childcare and medical costs in creating or deepening poverty
- The genuine poverty-reduction impact of programs like the Earned Income Tax Credit and SNAP
- More accurate geography of hardship — where struggling households actually are
The SPM is an improvement over the official poverty line — more accurate, more geographically sensitive, more attentive to the real structure of household budgets. But it still falls short of what the living wage provides, because the SPM is still designed as a poverty measure — identifying households at the bottom — rather than a self-sufficiency benchmark that tells you whether a working household can cover its needs without assistance.
Think of it this way: the official poverty line identifies who is drowning. The SPM identifies who is underwater. The living wage identifies who can swim without help. These are related but genuinely different questions, and different tools are needed to answer each one.
How the Gap Affects Program Eligibility in Practice
The most concrete way the poverty line vs. living wage gap affects real households is through program eligibility. Federal assistance programs use the poverty line — or a percentage of it — as their eligibility threshold. This means the gap between the poverty line and the living wage creates a large population of workers who are above the eligibility threshold for assistance but below the income level they actually need.
| Program | Typical income eligibility threshold | What this means in practice |
|---|---|---|
| Medicaid (adults, most states) | Up to 138% of Federal Poverty Level (FPL) in expansion states | Workers earning just above 138% FPL lose Medicaid eligibility but may not be able to afford marketplace premiums — a coverage gap |
| SNAP (food assistance) | Generally up to 130% FPL gross income | Many workers earning above 130% FPL still cannot afford adequate food alongside other essential costs — they are above the cutoff but not food-secure |
| CHIP (children’s health insurance) | Varies by state, typically 200–300% FPL | CHIP thresholds are generally more generous; some families still face coverage gaps at higher income levels in high-cost areas |
| CCAP / childcare subsidies | Varies significantly by state; typically 85–200% FPL | Many states have very low thresholds, cutting off childcare assistance at income levels well below the living wage for families with children |
| ACA marketplace subsidies | Up to 400% FPL (enhanced subsidies temporarily extended) | Broader coverage than other programs; subsidies phase out gradually rather than cutting off sharply, reducing the cliff effect |
| Housing assistance (Section 8) | Generally up to 50–80% of Area Median Income (uses different benchmark) | Uses AMI rather than FPL, which creates slightly better geographic sensitivity — but demand vastly exceeds supply regardless of eligibility |
The common thread across most programs is a threshold that cuts off assistance at income levels significantly below the living wage. This creates the benefits cliff — a point at which a wage increase causes a worker to lose benefits worth more than the raise itself. The worker ends up financially worse off for earning more. This is a well-documented structural problem in how poverty-line-based eligibility interacts with the reality that many workers need income well above the poverty line to cover their actual expenses.
💡 Practical application: If you are evaluating whether you qualify for assistance programs, use the federal poverty line thresholds for each program — that is what determines eligibility. If you are evaluating whether your income is actually sufficient to cover your household’s basic expenses, use the living wage from the MIT Living Wage Calculator. These are different questions that require different benchmarks.
Real-World Examples of the Gap
Abstract comparisons between two numbers are less useful than seeing how the gap plays out in specific, recognisable situations. The examples below are illustrative — composite scenarios based on realistic income and cost structures. They show how the same income can look very different through the lens of the poverty line versus the living wage.
🏘️ Example 1: The $28,000 warehouse worker in Chicago
A single adult earning $28,000/year in Cook County is comfortably above the federal poverty line (~$15,600 for a single person). Official statistics count them as not in poverty. But the living wage for a single adult in Cook County is approximately $40,000–$44,000/year. They are $12,000–$16,000 below what they actually need to cover basic expenses without assistance. Officially fine; practically struggling.
👨👩👧 Example 2: The $45,000 family in Dallas
A single parent with two children earning $45,000/year in Dallas County is well above the poverty line for a family of three (~$26,000). They would not qualify for most poverty-targeted assistance. The living wage for a single parent with two children in Dallas County, however, is approximately $65,000–$75,000/year. They are $20,000–$30,000 below what their household genuinely requires. Three times the poverty line — and still well short of a living wage.
🌆 Example 3: The $55,000 couple in Boston
Two adults earning a combined $55,000/year in Suffolk County, Massachusetts are nearly four times the federal poverty line for a two-person household (~$22,500). They are thoroughly above poverty by any official measure. The living wage for two adults both working in Suffolk County is approximately $52,000–$56,000 per adult — meaning each person needs to earn close to what they are together earning. At $55,000 combined, they are below the living wage for their household type by a significant margin.
🌾 Example 4: The $22,000 farmworker in rural Alabama
A single adult earning $22,000/year in a low-cost Alabama county is above the poverty line and — in this case — actually approaches the living wage for that county, which may sit around $28,000–$32,000. The gap still exists, but it is narrower. This is one of the few contexts where the poverty line and the living wage are in the same general neighbourhood, and it illustrates why rural, lower-cost areas see a smaller (though still real) divergence between the two benchmarks.
Which Number to Use — and When
Both numbers have legitimate uses. Knowing which one to reach for in a given situation makes you a more informed reader of data, a more effective advocate for yourself, and a clearer thinker about income and poverty as policy questions.
If you are checking whether you qualify for Medicaid, SNAP, CHIP, childcare subsidies, or any other federal assistance program, the poverty line is the number those programs use. There is no point comparing yourself to the living wage for this purpose — eligibility is legally defined by the poverty guideline thresholds, not by what your living costs actually are. Check the specific income threshold for each program you are considering and compare your gross income against it.
If you want to know whether your income is actually sufficient to cover your household’s basic expenses without going into debt or relying on assistance, the living wage is the correct benchmark. It is county-specific, household-specific, and built from real local cost data. Use the MIT Living Wage Calculator for this purpose, not the poverty line.
When government agencies report poverty rates, they use the official poverty line. If you want to understand what those statistics mean — and importantly, what they leave out — knowing how the poverty line is constructed and where it falls short helps you read the numbers more critically. Official poverty rates substantially undercount material hardship, particularly in high-cost areas and for households with children.
When a politician claims a new minimum wage will “lift workers out of poverty,” check whether the proposed wage actually meets the living wage for the relevant location and household types. When a company announces a “living wage commitment,” verify whether their floor actually clears the MIT living wage figure for the counties where their employees work. The living wage gives you a concrete, research-based reference point for evaluating these claims.
For understanding trends in material hardship over time, or for evaluating the true impact of specific programs on poverty, the Supplemental Poverty Measure is more accurate than the official measure. It is published annually by the Census Bureau alongside the official poverty figures and is the preferred measure among most poverty researchers for analytical purposes.
The poverty line tells you about program eligibility. The living wage tells you whether your income actually covers your life. Run the free MIT Living Wage Calculator for your county and household type to get the number that actually matters for your personal financial picture.
Frequently Asked Questions
What is the difference between the poverty line and the living wage?
The federal poverty line is a government-defined income threshold used primarily for program eligibility. It was originally calculated in the 1960s from food cost data and is updated annually for general inflation — but its underlying formula has never been redesigned to account for modern housing, childcare, or healthcare costs. The living wage is a research-based calculation of what a worker actually needs to earn to cover real living expenses in their specific county and household type. The living wage is almost always significantly higher — sometimes by a factor of two to four.
Why is the federal poverty line so much lower than the living wage?
The poverty line was created by multiplying the cost of a minimum food budget by three, based on 1955 data showing food represented roughly one-third of household budgets. Since then, food’s share of household budgets has fallen while housing, healthcare, and childcare have grown dramatically. The formula updates for general inflation but not for the structural shift in what household budgets actually look like — which is why it consistently understates the income needed for basic self-sufficiency in modern America.
Can you be above the poverty line and still not earn a living wage?
Yes — and this describes tens of millions of American workers. In most U.S. counties, a worker can earn two to three times the federal poverty level and still fall short of the living wage for their location and household type. This population — above poverty in official statistics, below living wage in economic reality — is often called the working poor. They typically earn too much for many assistance programs but too little to cover their actual basic expenses without debt or other support.
Does the poverty line vary by location like the living wage does?
The federal poverty line does not vary by location in any meaningful way — it applies essentially the same threshold across the continental United States, with a modest adjustment only for Alaska and Hawaii. This geographic uniformity is one of its most significant limitations. The living wage, by contrast, varies dramatically by county based on local housing costs, childcare prices, and other factors. This is why the gap between the two benchmarks is most pronounced in high-cost coastal cities, and somewhat narrower (though still significant) in lower-cost rural areas.
What is the Supplemental Poverty Measure?
The Supplemental Poverty Measure (SPM) is an alternative poverty measure developed by the Census Bureau and Bureau of Labor Statistics, first published in 2011. Unlike the official poverty line, the SPM adjusts for geographic cost variation, counts non-cash benefits like SNAP and housing subsidies as income, and deducts necessary expenses like taxes, childcare, and out-of-pocket medical costs. It produces a more accurate picture of material hardship than the official measure, though it is not used for program eligibility and does not replace the living wage as a personal income adequacy benchmark.
Which is more useful — the poverty line or the living wage?
They serve different purposes. The poverty line is important for determining program eligibility — whether you qualify for Medicaid, SNAP, CHIP, or other assistance programs. The living wage is more useful for personal financial assessment — understanding whether your income is actually sufficient to cover real living expenses in your location without assistance. For personal financial planning, income adequacy evaluation, or assessing whether a job offer is genuinely sufficient, the living wage is the more meaningful and accurate measure. Use the MIT Living Wage Calculator for that purpose.
How do I know what the living wage is for my location?
The MIT Living Wage Calculator is the most widely used and methodologically rigorous tool for county-level living wage data in the United States. It accounts for local housing costs, food, healthcare, transportation, childcare, and taxes, and provides household-type-specific figures for every U.S. county. You can access it free through the Waldev MIT Living Wage Calculator.
Two Numbers, Two Different Questions — Know Which One Answers Yours
The federal poverty line answers the question: does this household qualify for assistance programs? It was built for administration, not analysis. It does its job for that purpose. But it was never designed to tell you whether someone’s income is actually sufficient for their life — and it does not do that job well.
The living wage answers a different question: can this household cover its basic expenses in this specific place without outside help? That is the question most people are actually asking when they wonder whether they earn enough, whether a job offer is adequate, or whether a proposed wage floor will genuinely improve lives. And it is the question the living wage was specifically built to answer.
For the latter question — the personal, practical one — the MIT Living Wage Calculator gives you a county-level, household-specific answer based on what things actually cost where you live right now. Not what food cost in 1963, multiplied by three.
The MIT Living Wage Calculator on Waldev is free and gives you a county-specific, household-specific living wage in under a minute. That is the benchmark for personal income adequacy — not the poverty line.
Dr. Amy Glasmeier’s research team maintains the county-level living wage methodology referenced throughout this article.
The U.S. Department of Health and Human Services publishes the official federal poverty guidelines annually — the administrative threshold used for program eligibility determinations.
The Census Bureau publishes the Supplemental Poverty Measure annually alongside the official poverty statistics, providing the more analytically rigorous alternative measure discussed in this article.
EPI’s Family Budget Calculator provides an additional income-adequacy benchmark complementary to the MIT living wage, useful for cross-referencing cost-of-living estimates across metro areas.
Disclaimer: This article is for general informational and educational purposes only. Federal poverty guideline figures referenced are approximate and based on published HHS guidelines — always check the current year’s official figures at hhs.gov for precise thresholds. Living wage figures are illustrative estimates based on MIT Living Wage Calculator methodology for representative county types, not precise figures for any specific county. For current, county-specific living wage data, use the MIT Living Wage Calculator directly. Program eligibility rules are subject to change — consult the administering agency or benefits.gov for current requirements. This article does not constitute financial, legal, or benefits advice.