You’ve probably seen the number — the living wage for a single adult in your county, printed on a government report or quoted in a news article. But a number sitting by itself doesn’t tell you much. What does a life built on that income actually look like, month to month? What does it cover? What does it leave out? And what happens when something goes wrong?
This guide builds three real, line-by-line monthly budgets using living wage figures as the income baseline — one for a single adult, one for a single parent with one child, and one for a dual-income couple with two children. The goal is to make the living wage concrete, not abstract. Because once you see where the money actually goes, a lot of things about financial stress in America start to make a lot more sense.
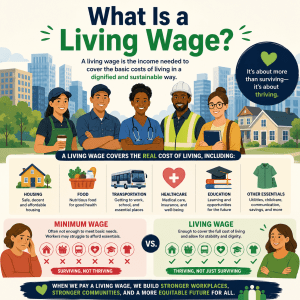
What the Living Wage Is — and Isn’t
Before building any budget, it’s worth being precise about what the living wage represents. The MIT Living Wage Calculator — which is the most widely referenced model in the United States — calculates the minimum income required for a household to cover basic necessities in a given county. It is built from six cost categories: housing, food, childcare (for applicable households), medical, transportation, and “other” necessities (clothing, personal care, basic household items).
That’s it. Nothing beyond necessities. The living wage does not include a vacation fund. It does not include retirement savings. It does not include paying off student loans or credit card debt, building an emergency fund, or anything that most financial planners would consider essential to actual financial health. It is, by design, a floor — not a goal.
This distinction matters enormously when you try to map it to a real monthly budget. A person earning exactly the living wage is, in MIT’s framework, covering their basic needs. But they are one car repair, one medical bill, one job disruption away from falling behind. There is no cushion built into the number. What you’re about to see is what that looks like in practice.
Note on the figures used in this guide: The budgets below use approximate mid-range living wage figures drawn from counties in medium-cost U.S. metropolitan areas — not the lowest-cost rural counties, and not the highest-cost cities like San Francisco or New York. Because the living wage varies significantly by location, the actual figures for your county may differ. To find the exact living wage for where you live, use the MIT Living Wage Calculator at Waldev and run the numbers for your own household type.
Before reading through these budgets, find the living wage for your county and household type. Use the free Waldev Living Wage Calculator — it runs on current MIT data and lets you select any household configuration.
How to Read These Budgets
Each of the three budgets below is structured the same way. You’ll see the assumed hourly living wage, converted to a monthly net take-home pay (after estimated federal and state income taxes and payroll taxes). Then you’ll see the monthly expenses, broken down by category. At the bottom of each budget, there’s a “balance” line — how much, if anything, is left over. And then there’s a “what’s missing” section listing the things the budget does not cover.
A few important notes on the methodology:
💼 Work hours assumed
All budgets assume full-time employment — 40 hours per week, 52 weeks per year, which equals 2,080 hours annually. The living wage is calculated on this basis. Anyone working fewer hours, or losing work due to illness or seasonal slowdowns, will fall short of these income figures.
📍 Cost location
Figures are approximate for a mid-cost metropolitan county — think a mid-size city like Columbus, Ohio or Charlotte, North Carolina. High-cost metros like Seattle, Boston, or Los Angeles will show higher figures on every line item, particularly housing and childcare.
💵 Tax treatment
Monthly take-home is estimated after federal income tax, state income tax (using a moderate state rate), Social Security, and Medicare. Tax credits like the EITC and Child Tax Credit are noted where applicable, as they genuinely affect net income for lower earners.
📊 Data transparency
All figures are illustrative estimates based on general cost data and the MIT Living Wage methodology. They are not pulled from a single specific county and will not match your situation exactly. They are designed to show proportions and patterns, not to serve as your personal financial plan.
This is the baseline household type — a single person living alone, working full-time. It is the simplest version of the living wage budget, and in some ways the most revealing: you can see, clearly, that even without the added costs of children, a single adult earning the living wage has very little room to maneuver.
Monthly Income
| Income Component | Monthly Amount | Notes |
|---|---|---|
| Gross monthly income (40 hrs/wk × ~$21/hr) | $3,640 | Based on 2,080 annual hours at the living wage |
| Federal income tax (estimated) | − $290 | Approximate for this income level, standard deduction applied |
| State income tax (moderate state) | − $145 | Varies significantly by state; some states have no income tax |
| Social Security & Medicare (7.65%) | − $278 | Payroll taxes — not deductible at this stage |
| Estimated monthly take-home | ≈ $2,927 | This is the number that has to cover everything |
Monthly Expenses
| Expense Category | Monthly Cost | % of Take-Home | Notes |
|---|---|---|---|
| 🏠 Housing (rent + utilities) | $1,150 | 39% | One-bedroom apartment, mid-cost metro; includes electric, gas, water |
| 🥦 Food | $380 | 13% | Groceries and minimal prepared food; no regular restaurant dining |
| 🚗 Transportation | $480 | 16% | Older vehicle: insurance, fuel, maintenance, registration — no car payment assumed |
| 🏥 Healthcare | $290 | 10% | Employer plan premium contribution + estimated out-of-pocket; varies enormously by employer |
| 👔 Other necessities | $350 | 12% | Clothing, personal care, phone, household items, renter’s insurance |
| 📶 Internet & phone | Included above | — | Folded into “other necessities”; basic phone plan and home broadband |
| Total monthly expenses | $2,650 | 91% | |
| Monthly balance | ≈ $277 | 9% | What remains after all necessities — before any extras |
Visualizing Where the Money Goes
Bar widths are proportional to share of take-home pay. Figures are illustrative estimates for a mid-cost metro county.
What This Budget Reveals
The single adult budget leaves roughly $277 per month after covering necessities. That sounds like a number. But consider what it has to absorb: any month where a prescription costs more than expected, a tire goes flat, a dentist visit comes up, or a work uniform needs replacing, that buffer disappears. By November, when electric bills start creeping up, or in July when the car needs new brakes, the math doesn’t quite work.
There’s also no rent increase built into this budget. If the landlord raises rent by $75 at lease renewal — which is a very modest increase in most markets right now — the buffer drops to $202. A $200 increase (not unusual in many metros) eliminates the buffer entirely. At that point, the worker is earning the living wage by MIT’s calculation but living below it in practice, because the model’s housing figure hasn’t kept up with what their specific apartment now costs.
Retirement savings (401k, IRA)
Emergency fund contributions
Student loan or debt repayment
Entertainment, dining, streaming, travel
Gifts, holidays, celebrations
Pet ownership costs
The jump from a single adult to a single parent is the largest proportional increase in the living wage model. Adding one pre-school-age child nearly doubles the required hourly wage in most counties. The reason is mostly one word: childcare. In the United States, licensed center-based infant and toddler care typically costs between $14,000 and $24,000 per year depending on location — which, for a full-time worker, is a second rent payment in addition to the actual rent.
This is not a budget for someone who is struggling. This is the budget for someone earning what MIT calculates to be the minimum for adequacy as a single parent. What you’ll see is that even at $36 an hour — a wage many workers in service industries will never reach — the margin is extremely thin, and that’s before anything goes wrong.
For a deeper look at why single-parent living wage figures are so much higher — and what strategies can help — see our full guide: Living Wage for Single Parents: What the Numbers Really Show.
Monthly Income
| Income Component | Monthly Amount | Notes |
|---|---|---|
| Gross monthly income (~$36/hr × 40 hrs/wk) | $6,240 | Based on 2,080 annual hours at the living wage for this household type |
| Federal income tax (estimated) | − $680 | After Head of Household filing status and standard deduction |
| Child Tax Credit (estimated) | + $167 | Up to $2,000/year per child; partially refundable — applied here as monthly equivalent |
| State income tax (moderate state) | − $250 | Varies by state; some states offer additional child deductions |
| Social Security & Medicare (7.65%) | − $477 | Payroll taxes on gross income |
| Estimated monthly take-home | ≈ $5,000 | Includes Child Tax Credit benefit folded in |
Monthly Expenses
| Expense Category | Monthly Cost | % of Take-Home | Notes |
|---|---|---|---|
| 🏠 Housing (rent + utilities) | $1,450 | 29% | Two-bedroom apartment to accommodate child; higher rent than one-bedroom |
| 🧒 Childcare | $1,350 | 27% | Licensed center-based care for a pre-school child, mid-cost metro. This is the dominant budget line item. |
| 🥦 Food | $550 | 11% | Groceries for two; no regular dining out; includes child’s meals |
| 🚗 Transportation | $530 | 11% | Slightly higher than single adult due to child-related errands and school dropoff routing |
| 🏥 Healthcare | $420 | 8% | Family-tier or employee+child plan premium contribution; includes child’s coverage |
| 👔 Other necessities | $450 | 9% | Clothing (children grow fast), personal care, household items, phone, internet, child supplies |
| Total monthly expenses | $4,750 | 95% | |
| Monthly balance | ≈ $250 | 5% | After all necessities — a thinner margin despite significantly higher income |
Visualizing Where the Money Goes
Bar widths are proportional. Childcare and housing together consume 56% of take-home pay — before any other expense is paid.
The Childcare Cliff in Plain Numbers
Childcare is the number that will strike most people reading this budget. At $1,350 per month, it is nearly as large as the rent payment. Together, housing and childcare consume 56 cents of every after-tax dollar. That leaves 44 cents to cover food, transportation, healthcare, clothing, a phone bill, internet, and everything else a household needs to function. That is the arithmetic reality of single-parent finances in most of America.
The good news, if there is any, is that this number has a fixed end date. Once a child reaches school age and can attend public kindergarten and then elementary school, the childcare line item largely disappears from the budget. The financial math for a single parent with a five-year-old is dramatically different from that of a single parent with a two-year-old. But getting to school age — which can mean five years of this kind of tight budget — is the hard part.
Retirement savings of any kind
Emergency fund or savings buffer
Child’s activities, enrichment, or sports
Student loan or debt repayment
Any entertainment or discretionary spending
Car replacement fund (vehicle eventually needs replacing)
The third budget shows what looks, on paper, like a better situation: two incomes, two working adults, shared expenses. And in some ways it is. The per-person required living wage for a two-adult household is lower than for a single adult, because costs like housing are shared. But add two children, and the required income for each adult rises again — because childcare, healthcare, food, and housing all scale upward with each additional person.
The living wage for a two-adult, two-child household in a typical mid-cost county requires each adult to earn approximately $25–$28 per hour. This budget uses $26/hr per adult. Both partners work full-time. The older child attends public school (no center-based childcare cost). The younger child is a toddler still in daycare.
Monthly Income (Combined Household)
| Income Component | Monthly Amount | Notes |
|---|---|---|
| Adult 1 gross monthly income (~$26/hr) | $4,507 | 40 hrs/wk, 52 weeks/year |
| Adult 2 gross monthly income (~$26/hr) | $4,507 | Same wage assumed; in reality, often different |
| Combined gross | $9,014 | |
| Federal income tax (estimated, Married Filing Jointly) | − $1,040 | After standard deduction; Child Tax Credit partially reduces this |
| Child Tax Credit (2 children, estimated) | + $333 | Up to $2,000/child; partially refundable; phase-in applies |
| State income tax | − $360 | Combined state liability estimate |
| Social Security & Medicare (both adults) | − $690 | 7.65% of each gross income combined |
| Estimated monthly take-home (combined) | ≈ $7,257 | Household take-home, both adults after tax and credits |
Monthly Expenses (Combined Household)
| Expense Category | Monthly Cost | % of Take-Home | Notes |
|---|---|---|---|
| 🏠 Housing (rent + utilities) | $1,900 | 26% | Three-bedroom to accommodate two children; includes all utilities |
| 🧒 Childcare (toddler only) | $1,200 | 17% | One child in center-based care; older child in public school (no childcare cost) |
| 🥦 Food | $900 | 12% | Groceries for four; limited dining out; school lunches may add cost |
| 🚗 Transportation | $860 | 12% | Two vehicles (or one vehicle + significant transit); insurance, fuel, maintenance for both |
| 🏥 Healthcare | $680 | 9% | Family-plan premium contributions; pediatric visits, dental, out-of-pocket costs |
| 👔 Other necessities | $700 | 10% | Clothing (two adults and two growing children), personal care, household, phones, internet |
| Total monthly expenses | $6,240 | 86% | |
| Monthly balance | ≈ $1,017 | 14% | Best remaining balance of the three budgets — but still no savings or retirement built in |
Why the Dual-Income Budget Looks More Comfortable — But Isn’t
At first glance, a $1,017 monthly balance looks far better than the $277 and $250 in the previous budgets. And it is better, in the sense that this household has more room to absorb a single unexpected expense without immediately going into debt. But a closer look reveals the fragility.
First, that $1,017 is the combined surplus for two adults and two children. There are no retirement contributions in this number. If both adults put just 5% of their gross into a 401(k) — a relatively modest savings rate — that’s roughly $900 per month leaving the household. Suddenly the buffer is $117. One of them has a $400 car repair. Now they’re behind.
Second, this budget depends on both adults working full-time continuously. If one partner loses their job, is laid off, has a health episode that prevents work for a month, or needs to take unpaid leave to care for a sick child, the entire model falls apart immediately. There is no income reserve to cover an income disruption of even two weeks.
Third — and this is critical — the childcare figure assumes the toddler ages into public school in a few years, at which point that $1,200 per month should theoretically become available for savings or other purposes. But in practice, that “freed-up” money tends to get absorbed by increased expenses that come with school-age children: activities, supplies, school fees, sports, birthday parties, clothes that get worn out faster, and the generally higher cost of keeping two school-age kids engaged and fed.
Retirement contributions for either adult
College savings (529 or any education fund)
Emergency fund (the $1K buffer is not a savings account)
Student loan repayment for either adult
Vehicle replacement fund (two cars eventually need replacing)
Children’s activities, enrichment, or extracurriculars
What These Budgets Don’t Include — And Why That Matters
The items missing from all three budgets deserve a full section, because they are not trivial. These aren’t luxuries. They’re the things that financial planners, retirement advisors, and personal finance educators consistently identify as the difference between a life that is financially stable over time and a life that remains perpetually precarious.
🏦 Retirement savings
Financial planners typically recommend saving 10–15% of gross income for retirement. In the single adult budget, 10% of gross would be $364 per month — more than the entire remaining balance. Putting nothing away for retirement at this income level is financially rational in the short term but catastrophic over a full working life. This is one of the primary drivers of retirement poverty in America.
🚨 Emergency fund
Standard financial advice calls for three to six months of expenses in an accessible emergency fund. For the single adult in Budget 1, three months of expenses is approximately $7,950. At a savings rate of $100/month — which would require cutting other necessities — it takes six and a half years to build that reserve. This is why any financial shock tends to send living-wage households into debt rather than into savings.
🎓 Student loan debt
If either Budget 1 or Budget 2 household is carrying student debt — which is increasingly common even for workers in non-professional fields who attended community college or completed a certificate program — there is no money in these budgets to service that debt. The living wage assumes a debt-free household. Many real households are not debt-free, which means their effective living wage floor is higher than what MIT calculates.
🦷 Dental and vision care
The healthcare line item in all three budgets covers basic medical insurance. Comprehensive dental and vision coverage is typically a separate premium. Routine dental cleanings, fillings, glasses, and contact lenses are not included in the healthcare allocation above. Many living-wage workers delay or forgo dental care — not because they don’t value it, but because there is simply no budget line for it.
🚗 Vehicle replacement
All three budgets assume the worker already owns a paid-off vehicle. Transportation costs cover insurance, fuel, and routine maintenance. But vehicles depreciate and eventually need replacing. A reliable used car costs $12,000–$18,000. On a living-wage budget, this is a multi-year saving project — or more commonly, a car loan that eats further into an already tight budget.
🎉 Social and family life
There is no budget line for birthday gifts, a child’s school trip, attending a friend’s wedding, or a family holiday. This isn’t just about quality of life — social participation has documented effects on mental health, social capital, and career development. The worker who cannot attend networking events, professional association meetings, or even after-work social occasions because they literally cannot afford to is also limiting their future earning potential.
When One Thing Goes Wrong
A living wage budget in a normal month is tight but manageable. The real stress test is what happens when a single unexpected expense occurs. Below are four realistic shock scenarios and their effect on each of the three budgets above.
🚗 Scenario A: Car breaks down. Repair bill: $800.
For the single adult (Budget 1), an $800 repair bill consumes nearly three months of the $277 buffer — meaning this person either takes on credit card debt, skips a bill payment, or cuts food spending for several weeks. For the single parent (Budget 2), the $800 exceeds three months of buffer in a single transaction. For the dual-income couple (Budget 3), it is absorbed by the monthly balance but leaves the household with essentially no cushion for the rest of that month.
🤒 Scenario B: Child is sick. Parent misses three days of work (no paid sick leave).
Many service-sector jobs at this income level offer limited or no paid sick leave. Three lost working days represents roughly 12 hours of lost pay at $21/hour for the single adult — approximately $252. Combined with any out-of-pocket co-pays for the child’s doctor visit, this event alone can wipe out the month’s remaining balance. For a single parent, missing work also means finding emergency childcare, which adds additional cost on top of lost wages.
🏠 Scenario C: Landlord raises rent by $150 at lease renewal.
This is the most common and most damaging shock for living-wage households. A $150/month rent increase — modest by the standards of most markets in 2024–2025 — effectively reduces the single adult’s monthly buffer from $277 to $127. At $127 per month, a single prescription that costs more than expected, or a co-pay for a sick visit, eliminates the entire buffer. For the single parent, the $150 rent increase reduces a $250 buffer to $100. That is not enough to absorb anything.
💼 Scenario D: One adult in Budget 3 is laid off. Unemployment insurance begins in three weeks.
In the dual-income household, both adults’ incomes are necessary to cover all expenses. If one partner loses their job, household income drops by roughly 50%. Even with unemployment insurance (which typically replaces 40–60% of prior wages), the household is immediately short on rent, childcare, and potentially several other categories. With no emergency fund in this budget, the family is looking at credit card debt within the first month.
These scenarios aren’t worst-case hypotheticals. They are normal life events that happen to most households over any rolling 12-month period. The point isn’t to be alarming — it’s to make concrete what “earning the living wage” actually means in terms of resilience. The living wage is necessary, but it is not sufficient for genuine financial security.
Before building your own budget plan, run the numbers for your specific county and household type using the free living wage calculator. The figures in this guide are illustrative averages — your local numbers will be different.
What Earning Below the Living Wage Actually Means
If the budgets above describe life at the living wage — tight, manageable in normal months, fragile under any shock — then it’s worth being direct about what life below the living wage looks like. This isn’t abstract policy analysis. Millions of full-time American workers earn below the living wage for their county and household type. The federal minimum wage is $7.25 per hour as of 2025. Even states that have raised their minimums to $15 or $16 per hour are still below the living wage in most mid- and high-cost counties.
| Hourly Wage | Annual (Full-Time) | Monthly Take-Home (est.) | vs. Single Adult Living Wage (~$21/hr) | vs. Single Parent Living Wage (~$36/hr) |
|---|---|---|---|---|
| $7.25 (federal minimum) | $15,080 | ~$1,290 | − $1,637/mo below | − $3,710/mo below |
| $12.00 | $24,960 | ~$2,010 | − $917/mo below | − $2,990/mo below |
| $15.00 | $31,200 | ~$2,470 | − $457/mo below | − $2,530/mo below |
| $17.00 | $35,360 | ~$2,760 | − $167/mo below | − $2,240/mo below |
| $21.00 (approx. single adult LW) | $43,680 | ~$2,927 | At floor | − $2,073/mo below |
| $36.00 (approx. single parent LW) | $74,880 | ~$5,000 | +$2,073/mo above | At floor |
The gap between “earning $15 an hour” and “earning the living wage as a single parent” is not a small calibration. It is roughly $2,500 per month in take-home pay. At $15 per hour, a single parent with one child in center-based care in a mid-cost metro cannot afford both rent and childcare simultaneously. Something gets cut, deprioritized, or covered through debt — and the most commonly cut item tends to be childcare quality, which then affects child development.
Important framing: The figures in the table above are illustrative estimates based on general mid-cost metro assumptions. Your county’s living wage will differ — sometimes significantly. To see the real gap between any specific wage and the living wage in your county, use the MIT Living Wage Calculator and compare the output to your actual income.
How Location Shifts Every Number in These Budgets
Every budget in this guide uses figures from a medium-cost metropolitan area. The same budget structure — same household type, same number of working hours — produces dramatically different numbers depending on where in the country you are. This isn’t a marginal difference. The living wage for a single adult in rural Mississippi might be around $16–$18 per hour, while the living wage for the same household type in San Francisco is over $30 per hour. The budgets look fundamentally different.
| Location Type | Approx. Single Adult LW | Housing (1-BR) | Largest Budget Pressure |
|---|---|---|---|
| Rural low-cost county (e.g., rural South/Midwest) | ~$16–$18/hr | ~$700–$850/mo | Transportation (long distances, no public transit) |
| Mid-size metro (e.g., Columbus, Charlotte, Memphis) | ~$19–$23/hr | ~$1,100–$1,400/mo | Housing (rising rents in many mid-size cities) |
| Large metro (e.g., Dallas, Chicago, Atlanta) | ~$23–$28/hr | ~$1,400–$1,900/mo | Housing + transportation |
| High-cost coastal city (e.g., NYC, SF, Boston, Seattle) | ~$28–$38+/hr | ~$2,200–$3,500+/mo | Housing (dominant — can exceed 50% of take-home) |
The important takeaway is that the budgets in this guide are not fixed realities. They are one representation of what a living wage budget looks like in one type of location. Your real numbers may be considerably lower or considerably higher.
The MIT data behind the living wage is published at the county level. To see the actual living wage figures for where you live — including the full cost breakdown by category — use the Waldev living wage calculator. Select your state, county, and household type.
If you’re comparing states or thinking about relocation, our companion guide Living Wage by State walks through how living wage requirements vary across all 50 states. And if you’re focused on specific city comparisons, Living Wage by City goes deeper into 10 representative U.S. markets with full cost context.
Using This as Your Personal Benchmark
The value of building out these budgets in detail isn’t just educational — it’s practical. If you know what a living wage budget actually looks like for your household type, you can use it as a meaningful personal benchmark in several specific ways.
Use the calculator to pull the MIT figure for your specific county and household type. This is your baseline number — the minimum income threshold that the model says you need.
Look at what you actually bring home after taxes each month. Is it above or below the take-home equivalent of the living wage? If it’s below, by how much? That gap is the number you’re working with.
Go through each cost category in this guide and compare your real spending to the model allocations. Where are you spending more than the model assumes? Housing is the most common one — if your rent is significantly higher than the model’s housing allocation, that explains a lot of budget pressure you may be experiencing.
Student loans, car payments, subscription services, credit card minimums, or anything else you’re paying that the MIT model doesn’t account for. Add those up. Your personal living wage is higher than MIT’s figure by the total of those items per month.
Once you know how far above the living wage you need to be to cover your real life — including savings, debt service, and the occasional unexpected expense — that number becomes your actual income target for salary negotiation, job searching, or career planning. The living wage is the floor. Your target should be above it.
For a practical walkthrough of how to turn living wage data into a negotiation strategy, see our guide: How to Use Living Wage Data to Negotiate Your Salary. And if you want to understand how the living wage has shifted over time — and why your income may feel like it’s going less far than it used to — the historical context is in How the Living Wage Has Changed Over the Last 10 Years.
Frequently Asked Questions
Does a living wage budget include any savings?
The MIT Living Wage model does not include a savings component beyond what is required for the specific necessities modeled. This is one of the most important things to understand about the living wage: it is a floor, not a comfortable income. A person earning exactly the living wage has virtually nothing left for retirement contributions, emergency savings, or large unexpected expenses. For the living wage figures applicable to your county, use the MIT Living Wage Calculator at Waldev.
What expenses are NOT included in the living wage budget?
The MIT model excludes savings beyond basic necessities, entertainment and recreational spending beyond a minimal miscellaneous allowance, clothing beyond a basic needs estimate, travel, debt repayment (student loans, credit cards), retirement contributions, and anything classified as a “want” rather than a “need.” This means someone earning the living wage who also carries student loan debt or any consumer debt is functionally earning below the living wage in real terms.
Can a single person actually live on the living wage?
In theory, yes — that is exactly what the living wage is designed to represent. In practice, it depends heavily on location and circumstances. In lower-cost counties, the living wage leaves a small buffer above bare necessities. In high-cost metros like San Francisco, New York, or Boston, even the living wage figure represents an income that many workers cannot actually achieve in their current job, and where the cost of housing alone can consume more than 40 percent of take-home pay even for someone earning the stated living wage.
How is the living wage budget different from the poverty line budget?
The poverty line is a federal threshold calculated on a simple food-cost multiplier developed in the 1960s. It does not accurately reflect modern costs for housing, childcare, healthcare, or transportation. The living wage, by contrast, is built from actual current market costs in each county. In most parts of the country, the living wage is roughly two to three times higher than the federal poverty line — which tells you something important about how outdated the poverty line has become as a measure of economic adequacy.
What happens to a living wage budget when rent goes up mid-year?
This is one of the most common real-world failures of a living wage budget: housing is typically the largest fixed cost, and when rent increases at renewal, the other budget categories have nowhere to compress. A person earning exactly the living wage has no discretionary buffer. A rent increase of $150 per month means $150 per month must come from somewhere else — usually food, transportation, or by going into debt. This is why earning slightly above the living wage, and building an emergency fund, matters more than the number itself.
Does the living wage budget change for different household sizes?
Yes — significantly. The MIT model calculates a separate living wage for each household type: single adult, single adult with one child, single adult with two children, two adults with no children, two adults with one child, and two adults with two children. The jump from single adult to single parent with one child is typically the largest proportional increase, because childcare is added as a major cost at the same time that housing must also accommodate a child. You can see the full breakdown for your county using the free calculator at Waldev.
Is the living wage enough to cover student loan payments?
No. The MIT model does not include student loan repayment. This is a significant omission for many younger workers who are carrying meaningful debt from college or trade programs. A worker earning the living wage who has $400 per month in student loan payments is effectively earning $400 below the living wage in terms of what is actually available for living costs. This is one of several reasons why the living wage should be seen as the absolute minimum starting point, not a comfortable income target.
How do I find the living wage for my specific county?
The MIT Living Wage Calculator, available for free at Waldev, lets you look up the current living wage for any county in the United States. You can select your household type — single adult, single parent with children, or two-adult household — and see the hourly living wage, annual salary equivalent, and a full breakdown of what cost components are included.
Put the Numbers to Work for Your Situation
The three budgets in this guide are illustrations of what living wage income looks like in practice. They are close to real, but they are not yours. Your county, your household, your cost of housing, your employer’s healthcare plan, your commute — all of these create a picture that is somewhat different from any general model.
The most useful thing you can do after reading this guide is find your specific number. The MIT data is available for every county in the United States, updated annually, and broken down by household type. It takes about two minutes to look up, and it gives you a concrete income benchmark that is far more useful than a national average or a general rule of thumb.
Use the free Waldev MIT Living Wage Calculator — select your state, county, and household type to see the current living wage, what it looks like as an annual salary, and the full cost breakdown behind the number.
What Is a Living Wage? A Plain-English Guide — the full explainer on what the living wage is, how it’s calculated, and why it matters.
How the Living Wage Has Changed Over the Last 10 Years — why the budget looks harder than it did a decade ago.
Living Wage for Single Parents — a full deep-dive into the cost structure that makes single-parent finances so challenging.
Living Wage by State — how the required income varies across all 50 states and what drives the differences.
Disclaimer
The budget figures and estimates in this guide are illustrative representations based on general cost data and the MIT Living Wage methodology. They are designed to demonstrate patterns and proportions, not to represent any specific household or county. Actual living wages, tax obligations, and cost of living vary significantly by location, household composition, employer, and individual circumstances. Nothing in this article constitutes financial advice. For your actual living wage figure, consult the MIT Living Wage Calculator. For personal financial planning, consult a qualified financial professional.