Social Security, a pension, and some savings sounds like a plan. But in most U.S. counties, that combination still falls short of what it genuinely costs to live. Here is what the numbers actually show — and how to check them for your own county.
Most retirement planning conversations center on a single question: do I have enough saved? But there is a more immediate question that many retirees discover too late: is what I currently receive each month enough to cover what life actually costs right now?
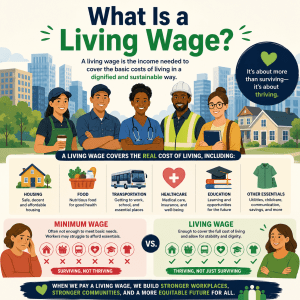
The living wage benchmark provides a useful anchor for this question. Calculated by researchers at MIT for every county in the United States, it represents what a person or household genuinely needs to earn — not to get rich, not to build significant savings, but simply to cover necessities without going into debt. Food, housing, healthcare, transportation, personal essentials, and taxes. Nothing more than what adequate, dignified living actually requires.
For seniors, this benchmark is especially revealing. Not because seniors are uniquely vulnerable — many are financially secure — but because the cost structure of a retired household looks very different from the working-age household the living wage is typically discussed in terms of. Childcare disappears. Healthcare surges. Housing remains a heavy fixed cost. The income sources shift from earned wages to fixed payments. And inflation continues to push costs upward whether income adjusts or not.
This guide walks through what the living wage framework means specifically for seniors and retirees, how the major cost categories shift with age, and what steps seniors can take to evaluate their own situation honestly.
Before reading further, it helps to have a real number in front of you. The MIT Living Wage Calculator on Waldev shows you what a single adult or couple needs to earn in your specific county — a useful benchmark for evaluating whether your retirement income is on solid ground.
What Is a Living Wage for Seniors?
The living wage, as defined by the MIT Living Wage Project, is the income a full-time worker needs to cover the basic costs of living in a given county — calculated annually and broken down by household type. It is not a poverty line (which most researchers consider an outdated and understated measure), and it is not a comfortable income. It is the floor of financial adequacy for a given place.
The model covers six core cost categories: food, housing, transportation, healthcare, personal necessities, and taxes (including civic taxes). Each category is estimated based on actual local costs rather than national averages, which is why the living wage can range from roughly $34,000 per year for a single adult in a low-cost rural county to more than $58,000 per year in a high-cost urban county.
Where Seniors Fit in the Model
The MIT calculator does not have a dedicated “senior” or “retired adult” household category. However, seniors are not excluded from using it — they simply use the household type that matches their living situation. For a retired person living alone, that is typically 1 Adult, 0 Children. For a retired couple, it is 2 Adults, 0 Children.
The important caveat is that the calculator models typical full-time working adults — and the healthcare cost assumptions in the model reflect working-age rates and coverage structures. For seniors on Medicare, the cost structure is different (and often higher for certain categories, particularly out-of-pocket expenses and supplemental coverage). This means the calculator’s output is a useful baseline for seniors, but actual senior costs — especially in healthcare — may run meaningfully higher than the calculator reflects.
A practical way to use it: Treat the MIT living wage figure for your county as a minimum floor, then add a healthcare adjustment to reflect your actual Medicare-related costs. The gap between that adjusted figure and your actual income is the clearest signal of where you stand financially.
How Seniors Can Use the Living Wage Calculator
The calculator is a lookup tool, not a planning application — but used thoughtfully, it gives seniors a county-specific, research-backed number to work with rather than a vague national average. Here is how to apply it most usefully.
The calculator shows data at the county level, which matters — costs within a single state can vary enormously. Rural Tennessee and Nashville are both in Tennessee. San Bernardino County and San Francisco County are both in California. Pick the county where you actually live or plan to live.
Select 1 Adult, 0 Children if you live alone, or 2 Adults, 0 Children if you are a couple. These are the most relevant configurations for most retirees. If you have a dependent adult in the household, use a configuration that reflects that.
This is your county-specific floor for basic cost coverage. Write it down. This is the benchmark you are comparing your income against.
If you are on Medicare, your actual annual healthcare costs — Part B premiums, Part D premiums, a Medigap or Medicare Advantage plan, dental, vision, hearing, and typical out-of-pocket spending — should be tallied separately and compared to the healthcare component shown in the calculator’s breakdown. Adjust the total accordingly.
Add up all income sources: Social Security, pension, annuity payments, and any planned or actual withdrawals from retirement accounts. If your total income exceeds the adjusted living wage, you are meeting the basic threshold. If it does not, the gap size tells you what requires attention.
National averages tell you very little about whether your income is sufficient. Use the Waldev living wage calculator to get the county-specific figure that actually applies to where you live.
Healthcare: The Cost That Changes Everything
For working-age adults with young children, childcare is typically the largest variable in the living wage calculation. It is the cost that most dramatically separates different household types. For seniors, that role shifts entirely to healthcare.
As we age, healthcare becomes both more necessary and more costly. The transition to Medicare at 65 provides important coverage, but Medicare is not free, and it is not comprehensive. Understanding the real healthcare cost picture for a retired household is essential to any honest income assessment.
Medicare Part B Premium
The standard Part B premium for most enrollees in 2025 is $185.00 per month per person. For couples, that is $370 per month in premiums alone, before any care is received. Higher-income beneficiaries pay more through the Income-Related Monthly Adjustment Amount (IRMAA).
Part D Drug Coverage
Medicare Part D prescription drug plans carry monthly premiums that vary by plan and location, averaging roughly $40–$60 per month in most states. Deductibles, formulary tier copays, and the coverage gap can add significantly to annual out-of-pocket drug costs.
Supplemental Coverage (Medigap)
Many Medicare beneficiaries purchase a Medigap supplemental policy to cover deductibles, coinsurance, and copays that Original Medicare leaves behind. Premiums vary by plan type and age but commonly run $100–$250 per month per person, with costs rising significantly for older enrollees.
Dental, Vision, and Hearing
Original Medicare covers almost none of these three categories. Dental cleanings, fillings, crowns, dentures, glasses, hearing aids, and audiologist visits are typically paid entirely out of pocket or through separate supplemental insurance. Hearing aids alone can cost thousands of dollars.
⚠️ Long-term care is not included in the living wage model
The MIT calculator captures day-to-day living costs. It does not include assisted living, memory care, home health aides, or nursing home costs — which can run $4,000 to over $10,000 per month depending on location and care level. These require separate planning and are distinct from the living wage baseline discussed in this article.
The Numbers That Frame the Gap
Before looking at individual scenarios, it helps to understand the broad scale of the issue. The figures below are general reference benchmarks for 2025, framed to illustrate typical relationships between retirement income and living costs.
Note: These are illustrative reference ranges, not guarantees or averages for your situation. Social Security benefit amounts vary widely based on earnings history and claiming age. Always verify your specific county’s living wage figure using the calculator and your personal benefit statements for an accurate assessment.
Three Real-World Senior Scenarios
Abstract comparisons are useful, but concrete scenarios make the gap feel real. The following three examples illustrate different retirement situations and how each one looks when measured against the living wage benchmark. All figures are illustrative examples designed to show how the analysis works, not predictions of any individual’s situation.
Scenario A: Single Retiree, Mid-Cost County, Social Security Only
Who: A 68-year-old woman living alone in a mid-size city in the Midwest — say, a county where the MIT living wage for a single adult is approximately $38,000 per year. She receives $1,650 per month in Social Security, having claimed at 64. She has a small savings account but does not draw from it regularly.
| Income / Cost Item | Monthly | Annual |
|---|---|---|
| Social Security income | $1,650 | $19,800 |
| Living wage benchmark (county) | ~$3,167 | ~$38,000 |
| Monthly shortfall | ~$1,517 | ~$18,200 |
This is a large gap. At $1,517 short each month, she is either drawing down savings faster than intended, living below the living wage standard (cutting food, deferring healthcare, or carrying credit card debt), or both. Unless she has significant retirement savings to draw from, this situation is financially precarious in the medium term.
What could help: SNAP eligibility, Medicare Savings Programs to reduce Part B premiums, utility assistance (LIHEAP), and potentially relocating to a lower-cost county. Part-time work would also close the gap meaningfully.
Scenario B: Retired Couple, Low-Cost Rural County, Social Security Plus Pension
Who: A 71-year-old retired teacher and her 73-year-old spouse living in a rural county in the South. The MIT living wage for 2 adults with no children in their county is approximately $52,000 per year. Together they receive $2,100 in combined Social Security and she receives a $1,400 monthly teacher’s pension.
| Income Source | Monthly | Annual |
|---|---|---|
| Combined Social Security | $2,100 | $25,200 |
| Teacher’s pension | $1,400 | $16,800 |
| Total income | $3,500 | $42,000 |
| Living wage benchmark (couple) | ~$4,333 | ~$52,000 |
| Monthly shortfall | ~$833 | ~$10,000 |
Better positioned than Scenario A, but still roughly $833 short each month. If they own their home outright, the effective housing cost drops substantially and the gap may close. If they rent or still carry a mortgage, the shortfall is real and likely accumulating. This is a common situation where the household feels “okay” but is quietly eroding savings or deferring costs.
What could help: Home ownership without a mortgage is the single biggest stabilizer here. A small IRA withdrawal of roughly $10,000 per year, taken strategically, would close the gap while minimizing tax impact. Reviewing Medicare Advantage vs. Original Medicare cost structures could also reduce annual healthcare spending.
Scenario C: Single Retiree, High-Cost Metro, Social Security Plus Retirement Savings
Who: A 70-year-old man living alone in a high-cost metro county — where the MIT living wage for a single adult is approximately $56,000 per year. He receives $2,400 per month from Social Security (having delayed until 70), and takes a $2,000 monthly distribution from his 401(k).
| Income Source | Monthly | Annual |
|---|---|---|
| Social Security (delayed to 70) | $2,400 | $28,800 |
| 401(k) distribution | $2,000 | $24,000 |
| Total gross income | $4,400 | $52,800 |
| Living wage benchmark (county) | ~$4,667 | ~$56,000 |
| After tax (approx. estimate) | ~$3,950 | ~$47,400 |
| After-tax shortfall | ~$717 | ~$8,600 |
On a gross basis this looks close to sufficient. But taxes matter. Social Security may be partially taxable, and 401(k) distributions are taxable income. After federal income tax (and potentially state income tax), the effective take-home may fall meaningfully below the living wage. This scenario illustrates why gross income comparisons can be misleading — the living wage represents what you need to actually spend, not what you receive before taxes.
What could help: Roth conversion strategies in prior years would reduce the tax drag on distributions. Reviewing whether a lower-cost county would reduce the living wage requirement without sacrificing care access is worth examining.
Retirement Income Sources Compared to the Living Wage
Most seniors draw on some combination of income sources. Understanding how each source behaves in relation to the living wage benchmark helps clarify where stability comes from — and where the vulnerabilities are.
| Income Source | Typical Annual Range | Inflation-Adjusted? | Key Limitation |
|---|---|---|---|
| Social Security | $10,000 – $40,000+ | Yes (COLA annually) | COLA often lags actual senior cost increases, particularly healthcare |
| Traditional pension | Varies widely | Often no, or partial | Fixed payments lose purchasing power over long retirements |
| 401(k) / IRA distributions | Flexible — set by retiree | Indirectly, via investment growth | Sequence-of-returns risk; taxable income; depletion risk |
| Roth IRA distributions | Flexible — tax-free | Indirectly, via investment growth | Requires prior contributions; no RMDs until 2024 law changes |
| Annuity income | Varies by contract | Depends on contract terms | Illiquid; inflation riders cost extra |
| Part-time work | $5,000 – $25,000+ | Market-rate wages | Physically and practically limited as age increases |
| Home equity (HELOC / reverse mortgage) | Varies | N/A | Erodes legacy value; complex terms |
Social Security COLA vs. Actual Senior Cost Inflation
Social Security benefits receive annual Cost of Living Adjustments (COLAs) tied to the Consumer Price Index for Urban Wage Earners and Clerical Workers (CPI-W). The problem is that the CPI-W tracks the spending patterns of working-age adults, not seniors. Since seniors spend a larger share of their income on healthcare — a category that has consistently inflated faster than general prices — the COLA has historically undercompensated senior purchasing power erosion over time. This is one reason why financial adequacy at the start of retirement does not guarantee adequacy twenty years later.
Location: The Biggest Lever Most Seniors Underuse
Of all the variables that affect whether a fixed income meets the living wage, where you live is the most powerful one available. A fixed income of $2,800 per month might fall $600 short of the living wage in one county and exceed it by $400 in another — without changing a dollar of income.
The MIT Living Wage Calculator is a county-level tool, which makes it ideal for relocation analysis. Before making a move, seniors can compare the living wage figures across candidate counties to understand how much their income would stretch in each location.
A Relocation Example
Consider a retired single adult with a total fixed income of $2,500 per month ($30,000 per year) evaluating whether to stay in their current county or move.
| County Type | Example Living Wage (Single Adult) | Monthly Income | Monthly Position |
|---|---|---|---|
| High-cost urban (e.g., Bay Area, NYC metro) | ~$56,000/yr (~$4,667/mo) | $2,500 | –$2,167 short |
| Mid-cost metro (e.g., Midwest city) | ~$38,000/yr (~$3,167/mo) | $2,500 | –$667 short |
| Low-cost mid-size city (e.g., smaller Southern city) | ~$34,000/yr (~$2,833/mo) | $2,500 | –$333 short |
| Low-cost rural county | ~$28,000/yr (~$2,333/mo) | $2,500 | +$167 surplus |
This table illustrates the dramatic range of outcomes a fixed income can produce depending on location. The same $2,500 per month that leaves a senior deeply underwater in a high-cost urban county produces a modest surplus in a low-cost rural county. These are illustrative figures — use the calculator to get the actual living wage for any specific county you are evaluating.
What to Research Beyond the Living Wage When Relocating
State income tax treatment of retirement income. Some states exempt Social Security and pension income entirely. Others tax all income. This can significantly affect your net income in retirement.
Property tax relief programs. Many states and counties offer property tax freezes, exemptions, or deferrals for seniors above a certain age or below a certain income threshold.
Medicare Advantage plan availability. Plan options, premiums, and network quality vary substantially by county. Moving to a rural area can mean fewer Medicare Advantage options and more limited specialist networks.
Proximity to healthcare facilities. A low-cost county without a nearby hospital or specialist clinic may produce hidden healthcare costs in travel time, transportation, and delayed care.
Medicaid and state benefit program eligibility. Medicaid rules and supplemental state benefit programs vary by state and can make a meaningful difference for seniors with incomes near the living wage threshold.
The free living wage calculator lets you look up any county in the United States. If you are evaluating a potential relocation, checking the living wage figure in each candidate county takes about 30 seconds and gives you a data point that most retirement planning conversations skip entirely.
How Senior Cost Categories Differ From Working-Age Adults
The six cost categories in the MIT model shift significantly when applied to a senior household. Understanding where costs rise and where they fall helps seniors see where their budget pressure is likely to come from.
🏠 Housing
Remains a major cost. For renters, housing typically represents the single largest monthly expense and rises with inflation. For homeowners without a mortgage, the effective housing cost drops substantially — though property taxes, insurance, and maintenance remain. Seniors who own their homes outright have a significant structural advantage in meeting the living wage threshold.
🥗 Food
Caloric needs often decrease modestly with age, but dietary quality and healthcare-related food requirements can increase costs in other ways. Food costs are relatively stable compared to other senior cost categories — but seniors on very tight budgets are most likely to cut food quality first, with significant health consequences over time.
🚗 Transportation
May decrease as seniors drive less and eventually stop driving. However, this creates a different cost: paid transportation alternatives (rideshare, paratransit, senior shuttle programs). Seniors who live in areas without robust public transit or senior transportation programs often find that giving up a car does not reduce transportation costs as much as expected.
🏥 Healthcare
Increases dramatically and becomes the dominant variable cost. Medicare premiums, supplemental coverage, out-of-pocket expenses, dental, vision, and hearing care all add up. This is the category where the MIT calculator most understates real senior costs, since it models working-age healthcare coverage rather than Medicare-era expenses.
👤 Personal & Miscellaneous
Relatively stable but can include costs the model does not fully capture — home modification for accessibility, personal care assistance, telephone and internet (increasingly essential for telehealth and social connection), and pet care. These costs are modest individually but can add several thousand dollars per year in aggregate.
💰 Taxes
Often lower in retirement due to reduced income, but not zero. Social Security benefits are taxable at the federal level above certain combined income thresholds. State income taxes on retirement income vary. Many seniors are surprised by their effective tax burden in retirement, particularly when 401(k) RMDs (required minimum distributions) push taxable income higher than expected.
| Cost Category | Direction vs. Working-Age Adult | Key Driver of Change |
|---|---|---|
| Housing | Same or lower (if mortgage-free) | Ownership status; location |
| Childcare | Eliminated | No dependent children |
| Food | Slightly lower to same | Reduced household size; dietary needs |
| Transportation | Same or slightly lower, shifting in type | Less commuting; more care-access trips |
| Healthcare | Significantly higher | Medicare premiums, dental/vision/hearing, chronic care |
| Personal / misc. | Similar or modestly higher | Accessibility modifications; care aids; telehealth |
| Taxes | Lower, but variable | Social Security taxation; RMD income; state rules |
When Income Falls Short: What Actually Happens
When a senior’s income falls consistently below the living wage, the gap does not simply go unmet. It gets closed somehow — and the mechanisms through which it gets closed tend to create compounding problems over time.
Deferring healthcare
Seniors below the living wage frequently delay dental care, skip specialist referrals, ration medications, or avoid preventive screenings. These deferrals reduce short-term spending but often result in significantly higher costs and worse health outcomes later.
Reducing food quality
Cutting grocery spending by buying cheaper, lower-nutrition food is common. This often exacerbates chronic conditions like diabetes, hypertension, and cardiovascular disease — conditions that then drive higher healthcare costs.
Accumulating consumer debt
Credit card debt to cover monthly shortfalls is a growing problem among seniors, particularly those on fixed incomes without emergency savings. At high interest rates, this debt can become unmanageable rapidly.
Accelerating asset depletion
Drawing down savings faster than planned to cover monthly gaps may feel like a short-term solution but reduces the safety buffer available for future large expenses — a major home repair, a health event, or long-term care needs.
Relying on family support
Adult children frequently supplement parental income informally, often without explicit discussion. While family support is meaningful, it is also financially and emotionally unpredictable and should not function as the primary gap-closing mechanism.
Housing instability
Seniors who rent face the risk of being priced out of their housing as rents rise faster than fixed income COLA adjustments. Senior homelessness and housing insecurity are growing issues in many U.S. metro areas, particularly in high-cost coastal markets.
Government Programs That Help Close the Gap
Multiple federal and state programs exist specifically to support seniors whose income falls below what is needed to cover basic costs. These programs are often underutilized — many eligible seniors are either unaware of them or reluctant to apply.
| Program | What It Covers | How to Access |
|---|---|---|
| Supplemental Security Income (SSI) | Cash income supplement for seniors 65+ with very limited income and resources | Apply through the Social Security Administration |
| Medicare Savings Programs (MSP) | Reduces or eliminates Medicare Part B premiums, deductibles, and cost-sharing | Apply through your state Medicaid office |
| Extra Help / Low Income Subsidy (LIS) | Reduces Part D prescription drug costs for lower-income Medicare beneficiaries | Apply through SSA or automatically enrolled if receiving SSI |
| SNAP (food assistance) | Monthly food benefit; seniors with low income often qualify; thresholds differ from working-age rules | Apply through your state SNAP agency or local social services office |
| LIHEAP | Energy assistance to help cover heating and cooling costs | Apply through your state energy office; typically seasonal |
| State pharmaceutical assistance | Many states offer additional drug cost assistance beyond Medicare | Varies by state; check your state aging agency or BenefitsCheckUp.org |
| Area Agency on Aging (AAA) | Connects seniors to local programs — meals, transportation, benefits counseling | Find your local AAA at eldercare.acl.gov or call 1-800-677-1116 |
BenefitsCheckUp.org — operated by the National Council on Aging — allows seniors to enter their basic information and see which federal and state benefit programs they may qualify for. It is one of the most practical tools available for identifying unclaimed assistance.
Planning Strategies for Senior Income Adequacy
Whether you are approaching retirement or already in it, the living wage benchmark gives you a concrete number to plan around. Here are the most impactful strategies for ensuring income stays above that floor.
1. Delay Social Security if possible
Claiming Social Security at 70 rather than 62 increases the monthly benefit by roughly 76% (8% per year from full retirement age to 70, plus the difference from 62 to FRA). For anyone in good health, delaying is the single highest-return “investment” available — and the larger benefit provides much stronger inflation protection over a long retirement.
2. Prioritize eliminating housing debt
Entering retirement mortgage-free dramatically reduces the monthly income needed to meet the living wage. If this is achievable, it should typically take priority over most other financial planning goals in the years approaching retirement.
3. Model income against county-specific living wage
Do not compare your income to national averages. Look up the actual living wage for your county using the calculator and run the comparison at least annually. Costs change, benefit amounts change, and the gap can widen or close year to year in ways that deserve active attention.
4. Evaluate Medicare coverage annually
Medicare open enrollment runs from October 15 to December 7 each year. Plan options, premiums, and formularies change annually. Reviewing your coverage each year — especially your Part D drug plan against your current prescription list — can meaningfully reduce out-of-pocket healthcare costs.
5. Consider Roth conversion strategies pre-retirement
Converting traditional IRA or 401(k) funds to Roth accounts in lower-income years before RMDs begin reduces the taxable income that hits from required distributions — which can push some retirees into higher tax brackets and affect Medicare premium calculations through IRMAA.
6. Apply for all programs you are entitled to
Benefits like the Medicare Savings Program, SNAP, LIHEAP, and state assistance programs are not charity — they are funded programs that eligible seniors have paid taxes to support throughout their working lives. Apply for everything you qualify for. The stigma is not worth the financial gap.
Planning works best when it starts with a real number. Use the MIT Living Wage Calculator to find the living wage for your specific county, then compare it against your total retirement income. The gap — or surplus — tells you exactly what you are working with.
Frequently Asked Questions
Does the MIT Living Wage Calculator include a senior household type?
The MIT Living Wage Calculator does not have a dedicated “senior” household category, but seniors can use it meaningfully. The most relevant selections are typically 1 Adult, 0 Children or 2 Adults, 0 Children, depending on household composition. These selections show what a single adult or couple genuinely needs to cover housing, food, healthcare, transportation, and other essentials in their specific county.
Because healthcare costs rise significantly with age, actual senior costs will often run higher than the calculator’s baseline — making the calculator a useful floor estimate rather than a ceiling. The article above explains how to apply a healthcare adjustment to make the figure more accurate for your situation.
Is the average Social Security benefit enough to cover a living wage?
For most seniors in most U.S. counties, Social Security alone does not cover the full living wage. The average monthly Social Security retirement benefit is approximately $1,900 as of 2025, which amounts to roughly $22,800 per year. The MIT Living Wage Calculator shows that the living wage for a single adult ranges from approximately $34,000 to over $58,000 annually depending on the county.
This means the gap between typical Social Security income and the living wage is substantial in the vast majority of locations — particularly in higher-cost urban areas. Supplemental income from pensions, savings withdrawals, part-time work, or benefits programs is typically required to bridge the gap.
Why is healthcare such a large cost for seniors compared to younger adults?
Healthcare costs increase with age because older adults require more frequent medical services, prescription medications, specialist care, and preventive treatments. Medicare covers a significant portion of costs but does not cover everything — premiums for Medicare Part B and Part D, supplemental Medigap policies, dental care, vision, hearing aids, and long-term care represent major out-of-pocket expenses.
A 65-year-old today can expect to spend considerably more on healthcare annually than a 35-year-old, and those costs tend to rise further with each decade. This is why healthcare, not childcare, becomes the dominant variable cost in senior household budgets.
What is the biggest mistake seniors make when planning retirement income?
The most common mistake is underestimating how much costs will increase over time due to inflation, rising healthcare expenses, and potential long-term care needs. Many seniors plan based on current costs and assume those costs will remain stable, but housing costs, prescription prices, and care costs tend to rise faster than general inflation.
A second common mistake is treating the living wage as the target rather than the floor. The living wage benchmark covers necessities but not savings, travel, or family support. Planning for a buffer above the living wage threshold provides significantly more financial security in practice.
Can seniors use the living wage benchmark to evaluate whether to relocate?
Yes, and it is one of the most practical applications of the tool for retirees. The MIT Living Wage Calculator shows county-level data, which means seniors can compare what their income buys in their current county versus a lower-cost county or state.
A fixed income that falls short in a high-cost urban county might cover the full living wage in a rural or lower-cost metro county. Pairing the calculator with research on state tax treatment of retirement income, Medicaid rules, and proximity to healthcare adds a more complete picture of what a potential move would mean financially.
Does the living wage account for long-term care costs?
The MIT Living Wage Calculator does not include long-term care costs in its baseline model. It captures recurring necessities — food, housing, healthcare, transportation, personal items, and taxes — but does not incorporate the cost of assisted living, memory care, in-home care aides, or nursing home care.
These are significant potential costs for seniors as they age, often running into thousands of dollars per month. Seniors should treat the living wage figure as covering day-to-day adequacy while planning separately for long-term care through insurance, savings, or Medicaid planning.
What government programs can help seniors whose income falls below the living wage?
Several federal and state programs are available to help seniors whose income falls below what is needed to meet their costs:
Supplemental Security Income (SSI) provides additional income for seniors with very limited resources. Medicare Savings Programs can reduce Medicare premiums and cost-sharing for lower-income beneficiaries. SNAP provides food assistance. LIHEAP helps with utility costs. Many states also have pharmaceutical assistance programs and property tax relief for seniors.
The Area Agency on Aging (eldercare.acl.gov / 1-800-677-1116) in your area can help identify which programs you qualify for locally. BenefitsCheckUp.org from the National Council on Aging is another practical resource for identifying unclaimed assistance.
Check Your Own Numbers Today
Everything in this article points to the same practical starting point: knowing what your county’s living wage actually is, and comparing that to your total retirement income, gives you the most honest picture of where you stand.
National retirement planning rules of thumb — “replace 80% of pre-retirement income,” “the 4% withdrawal rule,” “save $1 million” — are starting points designed for the average household in the average location. Your situation is specific to your county, your household size, your healthcare needs, and your income sources.
The living wage benchmark is not a complete retirement plan. It does not account for long-term care, legacy goals, or the lifestyle choices that make retirement meaningful. But it is the most direct answer to the most important question: is my income actually enough to cover what life costs here?
Look up the living wage for your specific county — or any county you are considering moving to — with the MIT Living Wage Calculator on Waldev. It takes less than a minute and gives you a research-backed, county-specific benchmark that most retirement planning conversations skip entirely.
Disclaimer
This article is for general educational and informational purposes only. It does not constitute financial, tax, legal, or medical advice. The living wage figures cited are based on the MIT Living Wage Project methodology and are subject to change. All income examples and scenario figures are illustrative only and do not represent predictions, guarantees, or advice applicable to any individual’s situation. Social Security benefit amounts, Medicare premium figures, and program eligibility thresholds change annually — always verify current figures directly with the Social Security Administration, Medicare.gov, and your state’s relevant agencies. Consult a qualified financial advisor, tax professional, or attorney for guidance specific to your circumstances.