Moving to a new country is expensive in ways the standard models do not fully capture. This guide explains how the living wage applies to immigrant households — and what it takes to actually reach financial stability when you are starting from zero in an unfamiliar economy.
What the Living Wage Measures — and Who It Is For
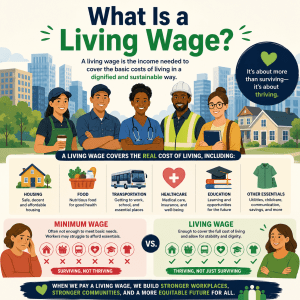
The living wage is a simple idea: the minimum hourly income a household needs to cover its basic costs in the place it actually lives. It is not a comfortable income. It is not a path to savings or retirement. It is the floor below which a household cannot cover food, housing, healthcare, transportation, and childcare without going into debt or making painful trade-offs between essentials.
The figure most widely used in the United States comes from the MIT Living Wage Calculator, which produces county-level estimates for different household types — a single adult, two adults, an adult with one child, and so on. The calculator accounts for six cost categories: housing, food, healthcare, transportation, childcare, and taxes. It updates regularly as costs change.
What the calculator does not do — and does not claim to do — is adjust its estimates for immigration-specific financial realities. It does not account for money sent abroad. It does not adjust for the wage penalties many newly arrived workers face in their first years. It does not reflect the larger household sizes common in some immigrant communities, or the restricted access to public benefit programs that affects some immigration statuses.
This means that for many immigrant households, the standard living wage figure is a starting point — but the real income target is higher. Understanding the gap between the published number and the actual household need is the first step to setting realistic income goals.
Before applying any of the adjustments in this guide, look up the base living wage for your specific county and household type. The MIT Living Wage Calculator lets you enter your state, county, and household configuration to get a precise starting figure.
What the Standard Model Misses for Immigrant Households
The MIT model is built around a typical U.S.-born household of a specific size in a specific county. It is a powerful, well-researched benchmark. But the life of a newly arrived immigrant household often diverges from that template in several financially significant ways.
Understanding these divergences is not about criticizing the model — it is a genuinely useful research tool for anyone. It is about recognizing where additional adjustment is needed to make the output actionable for your specific situation.
The Remittance Factor: The Expense the Calculator Does Not See
For a large share of immigrant households in the United States, sending money to family abroad is not optional. It is a financial obligation that comes before savings, before discretionary spending, and sometimes before non-essential categories the living wage model assumes can wait. For the household members depending on those transfers thousands of miles away, the money is often covering their own basic costs — food, medication, school fees, rent.
The scale of remittances from the United States is significant. The U.S. is consistently the world’s largest source of international remittance flows, with the top recipient countries including Mexico, China, India, the Philippines, Guatemala, and El Salvador, among many others. For individual households, the monthly transfer amounts vary widely — from $100 to a few hundred dollars for some families, to $500 to $1,000 or more for households with several dependents abroad.
Because these transfers do not appear in any U.S. cost-of-living model, they are effectively invisible to the standard living wage calculation. But they are not invisible to the household budget. A household that sends $400 per month abroad needs to earn $400 per month more than the living wage figure just to break even on everything else. At 40 hours per week for 52 weeks, that is roughly $2.30 extra per hour, every hour.
        Adjusted Living Wage = County Living Wage + (Monthly Remittances × 12 ÷ 2,080 hours)


        Example: County living wage = $19.50/hr · Monthly remittances = $400


        $400 × 12 = $4,800/yr ÷ 2,080 hrs = $2.31/hr additional


        Adjusted target = $19.50 + $2.31 = $21.81/hr
This formula is not complicated, but it is not being done by most people when they set their income goals. The result is that many immigrant workers believe they are earning a living wage when they have actually budgeted themselves below it — because the remittance obligation was never factored into the target.
| Monthly Remittance Amount | Annual Total Sent | Additional Hourly Wage Needed (Full-Time) | Adjusted Living Wage (Assuming $20/hr Base) |
|---|---|---|---|
| $100/month | $1,200 | +$0.58/hr | $20.58/hr |
| $250/month | $3,000 | +$1.44/hr | $21.44/hr |
| $400/month | $4,800 | +$2.31/hr | $22.31/hr |
| $600/month | $7,200 | +$3.46/hr | $23.46/hr |
| $800/month | $9,600 | +$4.62/hr | $24.62/hr |
| $1,000/month | $12,000 | +$5.77/hr | $25.77/hr |
Illustrative examples based on full-time work (2,080 hours/year). Figures show the additional hourly wage needed, on top of the base county living wage, to cover the remittance obligation. The $20/hr base figure is approximate — your actual county living wage will differ. Use the calculator to find your precise base figure, then apply this framework.
💡 Practical note on transfer costs: Wire transfer fees and exchange rate margins also cost money. A $400 transfer might cost $8–$20 in fees depending on the service used. Over twelve months, that adds another $100–$240 of effective cost. Digital transfer services (Wise, Remitly, and others) often offer significantly lower fees than traditional bank wire transfers. This is worth examining if remittances are a regular household expense.
Credential and Language Barriers: The Temporary Wage Gap
One of the most significant financial challenges for immigrant workers with professional training is that their qualifications may not be immediately recognized in the United States. This affects an enormous range of professions — medicine, nursing, dentistry, engineering, law, accounting, pharmacy, architecture, and many others have licensing or credentialing requirements that do not automatically transfer from foreign institutions.
The result is a period — sometimes months, sometimes years — during which a highly trained professional earns an entry-level income. The household’s financial reality during this window does not reflect the worker’s actual skill level or long-term earning potential. It reflects the credential gap. And during that window, the living wage calculation applies in full — there is no discount for eventual future earnings.
How Long Does Recredentialing Take?
The duration varies widely by profession and by the country where the credential was originally earned. The table below shows approximate timelines for common professional categories. These are general reference ranges — individual cases vary based on the specific credential, the licensing board’s requirements, and the applicant’s preparation.
| Profession | U.S. Licensing Requirement | Approximate Recredentialing Timeline | Interim Income Options |
|---|---|---|---|
| Physician (MD/DO) | USMLE Steps 1–3 + residency match | 2–5+ years depending on specialty and visa type | Medical research, clinical assistant, lab roles |
| Registered Nurse (RN) | NCLEX exam + state license | 6–18 months (credential evaluation + exam prep) | Certified nursing assistant (CNA), home health aide |
| Engineer | PE license (state-specific); often EIT first | 1–3 years if starting EIT process fresh | Engineering technician, CAD drafter, construction supervision |
| Lawyer / Attorney | Bar exam (state-specific); LLM sometimes required | 1–3 years; some states restrict foreign-trained attorneys | Paralegal, legal research, translation services |
| Pharmacist | FPGEC certification + NAPLEX + state license | 1–3 years | Pharmacy technician, healthcare administration |
| Dentist | NBDE (Parts I & II) + clinical exam + state license | 2–4 years | Dental assistant, dental hygienist (separate credential) |
| Accountant (CPA) | CPA exam + state board; foreign credits often partially accepted | 6 months–2 years | Bookkeeping, accounts payable, financial analyst roles |
| Teacher | State teaching license; requirements vary | 6 months–2 years; additional coursework often required | Substitute teaching (may not require license), tutoring, ESL instruction |
During the recredentialing period, the household must survive on whatever the interim income is — not on what it will eventually be. This makes living wage planning for this phase critical. Underestimating how long recredentialing will take, or overestimating what interim jobs will pay, is one of the most common financial planning mistakes in newly arrived professional immigrant households.
The Language Proficiency Wage Gap
Separate from credential barriers, English language proficiency has a measurable effect on wages for immigrant workers in English-speaking workplaces. Research consistently shows that workers with limited English proficiency earn less than workers with equivalent skills and experience who are fully fluent — and the gap is largest in the early years of U.S. residence and narrows as language skills improve.
This is not a permanent condition. Most adult immigrants who commit to language study show meaningful improvement within two to three years. But during that window, the wage penalty is real and should be factored into financial planning. Household income targets during the language learning phase need to account for the fact that current wages may be below eventual wages — meaning the budget must work at current income, not projected income.
💡 Free and low-cost English language programs are available in most U.S. counties through public libraries, community colleges (ESL programs), and local nonprofit literacy organizations. Accelerating language acquisition is one of the highest-return investments a newly arrived worker can make — it reduces the language wage penalty and opens access to a wider range of job opportunities.
Multi-Generational Households: How Shared Living Changes the Math
In many immigrant communities, the nuclear family model assumed by standard U.S. cost-of-living benchmarks does not reflect how households actually function. Multi-generational living — where parents, adult children, and sometimes extended family members share a residence — is common in households from Latin American, Asian, East African, South Asian, and many other cultural backgrounds. It is also economically rational.
Shared housing is, by a wide margin, the single most effective way to reduce the per-person cost of living. The MIT Living Wage Calculator’s largest cost category in most counties is housing. If that cost is divided among two or three adults instead of one, the individual financial target drops significantly.
How to Adapt the Calculator for Multi-Adult Households
The calculator does not have a direct configuration for, say, three working adults sharing a household. But you can approximate the right figure with a simple manual approach.
Look up the living wage for the total number of adults and children in the household using the MIT Living Wage Calculator. Select the configuration that most closely matches your actual household — for example, 2 adults and 2 children. Note the household annual living wage (not the per-person figure).
The calculator provides a breakdown of annual costs by category: housing, food, healthcare, transportation, childcare, and taxes. Add these up to find the total annual household cost. This is the amount the household collectively needs to generate in income.
If two or three adults in the household are working and contributing income, divide the total household annual cost by the number of earners. The result is the per-person annual income target. Convert to hourly by dividing by 2,080 (for full-time work).
Add any monthly remittance amounts and ongoing integration costs (language courses, licensing exam fees, credential evaluation fees) to the annual cost total before dividing. This gives you the most complete per-person income target for your household’s actual situation.
The Tradeoffs of Multi-Generational Living
Shared housing reduces financial stress, but it also creates other pressures. Privacy is reduced. Household decision-making becomes more complex. If one adult loses their job or has a medical emergency, the shared financial model can be disrupted. And in some housing markets, finding a large enough unit for an extended household — at a rent that makes the cost-sharing math work — is harder than it sounds.
None of this means multi-generational living is a bad strategy. For many immigrant households in the early years, it is the strategy that makes financial stability possible at all. The key is to treat it as a planned arrangement with explicit financial goals, not an indefinite default — and to use the living wage calculation to define what each person needs to contribute for the model to work.
| Household Configuration | Single-Earner Target (Full Burden) | Dual-Earner Target (Per Person) | Cost Reduction from Sharing |
|---|---|---|---|
| 1 adult, no children — mid-size city | ~$20/hr | N/A | — |
| 2 adults, no children — mid-size city | ~$14/hr each (shared) | ~$14/hr | ~30% reduction per person vs. solo |
| 2 adults, 2 children — mid-size city | ~$38–42/hr (one earner covers all) | ~$19–21/hr each | ~50% reduction per earner |
| 3 adults, 2 children — mid-size city | ~$38–44/hr (one earner) | ~$13–15/hr each (three earners) | ~65% reduction per earner |
Illustrative figures for a representative mid-size U.S. city. Actual figures vary significantly by county. Use the calculator to find your precise starting figure before applying household-sharing adjustments.
Immigration Status and Access to Public Benefits
The living wage model implicitly assumes that a household in severe financial difficulty can access at least some public safety net programs — Medicaid for healthcare emergencies, SNAP for food cost support during a job loss, CHIP for children’s healthcare coverage. For U.S.-born households, this assumption is reasonably accurate. For immigrant households, access depends heavily on immigration status and how long the person has been in the country.
This matters for living wage planning because a household with no access to the public safety net must maintain a higher income buffer. There is no emergency Medicaid for an adult worker with a work authorization visa. There is no SNAP to fill the gap during a period of reduced hours. The living wage figure itself, designed to cover basic costs, must be maintained more reliably — because there is less cushion if it falls short.
Benefit Access by Immigration Status: A General Overview
Important: Benefit eligibility rules are complex, change regularly, and vary by state. This overview provides general guidance only. For accurate eligibility information specific to your household and status, consult a nonprofit immigration legal services organization or benefits.gov. Do not rely solely on this guide to make eligibility decisions.
| Immigration Status | SNAP (Food) | Medicaid (Health) | CHIP (Children’s Health) | SSI / Cash Assistance |
|---|---|---|---|---|
| U.S. Citizen | ✅ Eligible | ✅ Eligible | ✅ Eligible | ✅ Eligible |
| Lawful Permanent Resident (5+ years) | ✅ Generally eligible | ✅ Generally eligible | ✅ Generally eligible | ✅ Generally eligible |
| Lawful Permanent Resident (under 5 years) | ⚠️ Generally not eligible (federal); some state programs | ⚠️ Emergency Medicaid only (federal); states vary | ⚠️ States may cover children regardless | ❌ Generally not eligible |
| Refugee / Asylee | ✅ Eligible immediately | ✅ Eligible; refugee medical assistance for first 8 months | ✅ Eligible | ✅ Eligible for first 7 years |
| Work Visa Holder (H-1B, L-1, O-1, etc.) | ❌ Not eligible (federal) | ❌ Not eligible (federal) | ❌ Federal programs not eligible; some states cover children | ❌ Not eligible |
| DACA Recipient | ❌ Not eligible (federal) | ❌ Federal programs not eligible; some states (CA, NY, WA, IL, others) provide state-funded coverage | ❌ Federal not eligible; state programs vary | ❌ Not eligible |
| Undocumented Immigrant | ❌ Not eligible | Emergency Medicaid only | ❌ Federal not eligible; some states (CA, IL, WA, NY, others) cover all children regardless of status | ❌ Not eligible |
The practical implication of restricted benefit access is that the effective income floor is higher for households that cannot rely on these programs. A single adult on an H-1B visa who has a medical emergency does not have Medicaid as a backstop — their income must be sufficient to cover healthcare costs out of pocket, or they must have employer-provided health insurance, which is a strong reason why employer-sponsored healthcare is especially important to evaluate when considering job offers.
The Public Charge Rule and Its Impact on Benefit Use
Some immigrant households who are technically eligible for certain benefit programs choose not to use them out of concern about the “public charge” rule — a provision in immigration law that allows immigration officers to consider public benefit use when evaluating certain types of visa applications and green card petitions. Rules around public charge have changed several times in recent years and are complex.
The important thing to know is that the public charge rule currently applies primarily to certain visa applications made abroad and adjustment of status applications — and even then, only specific programs are considered. Using Medicaid, SNAP, or CHIP generally does not affect naturalization applications or the immigration status of existing green card holders. But because the rules are complex and the stakes of a misunderstanding are high, anyone with concerns about how benefit use might affect their immigration case should speak with a qualified immigration attorney or accredited representative before making decisions based on fear of the public charge rule.
Real Household Scenarios: What the Numbers Look Like in Practice
Abstract frameworks are helpful, but the numbers become much clearer when applied to specific household situations. The following four scenarios are composites — they are not based on any individual and the figures are illustrative — but they reflect the types of financial situations that are common among newly arrived immigrant households. Each scenario uses the living wage calculator as a starting point and then applies the adjustments described in this guide.
Recent Graduate, Tech Visa, No Dependents
A 28-year-old software developer arrives in Austin, Texas on an H-1B visa. They have no family in the U.S. and send $300/month to their parents abroad. Their employer provides health insurance.
Base living wage (Travis County, TX, 1 adult): Approximately $19–$21/hr
Remittance adjustment: +$1.73/hr
Healthcare: Covered by employer — no additional adjustment needed
Integration costs (year 1): One-time setup costs; budget separately
Adjusted target: ~$21–$23/hr ($44,000–$48,000/yr)
Their tech role pays $85,000 — well above the adjusted threshold. But if they accepted a lower offer below $45,000, the combined household burden and remittance obligation would put them in a difficult position, not a comfortable one.
Nurse Recredentialing, Spouse Working, Two Children
A family of four arrives in Houston, Texas. The primary earner is a registered nurse whose foreign credential is being evaluated — expected to take 12–14 months. In the interim, they work as a nursing assistant earning $15/hr. The spouse works part-time earning $13/hr. They send $250/month to family in their home country.
Base living wage (Harris County, TX, 2 adults + 2 children): Approximately $38–$42/hr combined, or ~$19–$21/hr each
Combined actual income: $15 + $13 = $28/hr combined (significantly below target)
Remittance adjustment: +$1.44/hr to combined target
Shortfall: Approximately $10–$13/hr in combined income
This is the credentialing gap in practice. The household’s income will increase substantially once the primary earner re-qualifies — but they need a specific, funded plan to bridge the 12–14 month gap. This might mean drawing on savings, accepting help from community organizations, or the spouse increasing hours.
Three Adults, Two Children, Shared Housing
A family of five — two parents and an adult sibling — lives together in a three-bedroom apartment in Chicago, Illinois. All three adults work. They send $500/month collectively to grandparents abroad.
Base household living wage (Cook County, IL, estimated for 5 people): Approximately $65,000–$72,000/yr total
Remittance addition: $6,000/yr
Total annual household need: ~$71,000–$78,000
Per earner (÷3): ~$23,700–$26,000/yr each (~$11.40–$12.50/hr)
Cost-sharing reduces the per-person target dramatically. At $15/hr each, the three adults collectively generate well above the adjusted household target — which is why this arrangement is so effective as a stability strategy in the early years.
Single Parent, Two Children, Refugee Status
A single mother arrives as a resettled refugee in Columbus, Ohio with two young children. She has refugee status, which provides immediate access to federal benefits. She is working toward a GED and employment certification while receiving initial resettlement support.
Base living wage (Franklin County, OH, 1 adult + 2 children): Approximately $30–$35/hr
Benefits offset (Medicaid, SNAP, CHIP): Approximately $12,000–$15,000/yr in program value — reduces effective income needed
Adjusted income target (with benefits): Approximately $15,000–$20,000/yr ($7.20–$9.60/hr)
Refugee benefit access changes the financial equation significantly in the early years. Medicaid covers healthcare — the largest variable cost. SNAP covers a portion of food. CHIP covers the children. The income target during the benefit period is far more achievable, giving the household a window to build skills and stability before transitioning to self-sufficiency.
📊 Before accepting a job offer, run the numbers: Use the free living wage calculator to check whether the salary covers your county’s threshold for your household type — then apply the remittance and integration cost adjustments from this guide. A salary that looks sufficient often falls short once the full household picture is accounted for.
Income Targets by Destination City: What Immigrant Households Actually Need
The living wage varies considerably across U.S. cities and counties. A figure that represents financial stability in rural Ohio would leave a household well below water in Los Angeles or New York. For immigrant households deciding where to settle — or evaluating whether a job offer in a particular city makes financial sense — the destination city matters as much as the salary figure.
The following table shows approximate living wage benchmarks for a single adult in representative destination cities for immigrant populations. These are general reference figures — your actual county will vary. Always use the calculator to get your precise number.
| City / Metro | Single Adult Living Wage (Approx.) | 2 Adults, 2 Children (Approx.) | Annual Income Needed (Single Adult) | Notes for Immigrant Households |
|---|---|---|---|---|
| New York City, NY | $26–$32/hr | $42–$52/hr combined | $54,000–$67,000 | High rent; large established immigrant communities; extensive transit reduces car costs |
| Los Angeles, CA | $24–$30/hr | $38–$48/hr combined | $50,000–$62,000 | High housing cost; car typically required; large support networks in many communities |
| Houston, TX | $18–$22/hr | $33–$40/hr combined | $37,000–$46,000 | Lower housing cost than coastal cities; car required; no state income tax |
| Chicago, IL | $20–$25/hr | $36–$44/hr combined | $42,000–$52,000 | Public transit available; diverse neighborhoods; cold winters increase utility costs |
| Miami, FL | $20–$25/hr | $36–$44/hr combined | $42,000–$52,000 | High rent in many neighborhoods; no state income tax; large Spanish-speaking community |
| Dallas/Fort Worth, TX | $18–$21/hr | $32–$39/hr combined | $37,000–$44,000 | Growing job market; car required; no state income tax; lower cost than coastal cities |
| Seattle, WA | $22–$28/hr | $38–$48/hr combined | $46,000–$58,000 | High cost of living; no state income tax; strong tech sector; significant Asian immigrant community |
| Minneapolis, MN | $19–$23/hr | $34–$42/hr combined | $40,000–$48,000 | Major destination for East African refugee communities; strong state benefit programs |
| Phoenix, AZ | $18–$21/hr | $32–$38/hr combined | $37,000–$44,000 | Growing metro; lower cost than coastal cities; car required; large Latin American community |
| Columbus, OH | $17–$20/hr | $28–$35/hr combined | $35,000–$42,000 | Growing Somali, Nepali, and Latin American communities; lower cost of living; refugee-receiving city |
All figures are approximate reference ranges based on general living wage estimates for major counties in each metro area. Actual living wage figures vary by specific county within each metro. Use the MIT Living Wage Calculator to find the exact figure for your county.
The Location Decision for Immigrant Households
Many newly arrived immigrants settle where family or community connections already exist — which is financially sensible. An established community network reduces the practical costs of arrival: you can borrow a folding table rather than buy one, get guidance on which landlords are reliable, and find out which jobs are realistic to apply for given your documentation situation. These social assets have real financial value that does not appear in any living wage table.
But community networks should not be the only factor in the location decision. The gap between a salary offer and the local living wage matters enormously. A $45,000 salary in Houston and a $45,000 salary in New York City represent dramatically different financial realities. Before accepting a job offer in a new city, it is worth spending five minutes with the living wage calculator to understand what the number means in that specific location.
Pathways to Financial Stability: Practical Steps for Immigrant Households
Understanding the living wage gap is not an endpoint — it is a starting point for a plan. The following section covers the most effective practical strategies for immigrant households in each stage of financial establishment.
In the First Six Months: Stabilize Before Optimizing
The first priority is covering basic costs reliably. Optimization can come later. The most important financial moves in the first six months are the least glamorous: secure stable housing without overextending, establish a realistic monthly budget based on actual current income (not projected future income), and understand which benefits programs you actually qualify for.
Use benefits.gov or 211 (call or text 211) to identify programs you or your children may be eligible for based on your immigration status and income. Programs you may have assumed you are not eligible for — particularly children’s healthcare programs in some states — may be more accessible than you think.
Add up actual current monthly costs: rent, utilities, food, transportation, and any remittance commitments. Compare this total to your current net monthly income. If there is a gap, identify specifically where it is — do not manage the feeling of financial stress, manage the actual numbers. The living wage calculator helps you benchmark this against what the county says a household like yours should actually need.
Most major metropolitan areas have nonprofit organizations that specifically serve immigrant communities — offering food assistance, emergency financial aid, free legal help, and connection to workforce training programs. These organizations often know of resources that do not appear in public databases. Local ethnic churches, mosques, and cultural associations are often the fastest way to find them.
If you have professional credentials that require U.S. certification, start the process in the first month, not the sixth. The longer a credential gap persists, the longer the household income stays below its potential. Credential evaluation (through NACES-accredited organizations) and English language enrollment should be treated as financial priorities, not optional self-improvement.
In the First Two Years: Close the Gap
The goal in years one and two is to move household income from below the adjusted living wage toward or above it. The levers available vary by household — but they tend to fall into four categories.
Increase Earning Capacity
Completing credential evaluations, passing licensing exams, improving English proficiency, and gaining U.S. work experience all increase what the labor market will pay. Each of these moves the household’s income ceiling upward. Prioritize the specific step that unlocks the biggest income increase for your particular profession.
Reduce Fixed Costs
Housing is the largest controllable cost in most counties. If a different neighborhood, county, or roommate arrangement can reduce rent by $300–$500/month, that is the equivalent of a $1.75–$2.90/hr wage increase. Cost reduction and wage increases are both tools — use both.
Add Income Sources
A second household member entering the workforce, or a part-time income source, can bridge a gap that neither party could close individually. This requires childcare — which has its own cost — so the net benefit must be calculated carefully. The relationship between childcare costs and the living wage is one of the most important variables in any household with young children.
Build Credit and Banking Access
Many newly arrived immigrants do not have U.S. credit history, which limits access to apartments, car financing, and sometimes employment (some employers run credit checks). Starting to build credit history — through a secured credit card or credit-builder loan — is a medium-term financial foundation step that pays dividends in years two and three through access to lower-cost financial products.
Workforce Training and Upskilling Programs
Most states fund workforce development programs that are accessible to immigrant workers regardless of status — with some variation by program and state. These programs can cover the cost of training for in-demand occupations, sometimes including credentials, tools, and even childcare support during training periods.
CareerOneStop (careeronestop.org), funded by the U.S. Department of Labor, allows workers to search for training programs, apprenticeships, and career services by location. Many community colleges offer workforce development courses at subsidized or zero cost for qualifying participants. Trade apprenticeships — which combine paid on-the-job training with formal instruction — are an especially effective pathway for immigrant workers, as they generate income while building the credential simultaneously.
Using the Living Wage Calculator: A Guide for Immigrant Households
The MIT Living Wage Calculator is one of the most useful free financial tools available for anyone establishing a household in the United States. It is anonymous — no account, no personal information, no immigration status required. It is updated regularly to reflect actual cost changes. And it is granular enough to distinguish between counties within the same state, which matters because costs can vary significantly even within a single metropolitan area.
Here is how to use it effectively as an immigrant household.
Visit the MIT Living Wage Calculator on Waldev. No login or registration is required. The tool is free and publicly accessible.
Use the location dropdowns to select the state and county where you actually live or plan to live. If you are deciding between two locations, run the calculator for both — the difference can be significant. The county matters more than the city name: if you live in the suburban county outside a major city, select that county, not the city’s county, because costs often differ.
Choose the configuration that most closely matches your household — number of adults and number of children. If your household does not match any configuration exactly (e.g., three adults and two children), select the closest available option and note that you will need to do a manual adjustment as described earlier in this guide.
The calculator outputs an hourly living wage figure and breaks it down by cost category. Pay particular attention to the healthcare and childcare rows — these are the categories most likely to require additional adjustment for households without employer-sponsored benefits or with reduced benefit program access.
Add your monthly remittance amount (annualized and converted to an hourly figure using the formula earlier in this guide). Add any ongoing integration costs. If your household shares costs across multiple adults, divide the total household annual cost by the number of income earners. This is your actual income target — not the base figure the calculator provides.
When you receive a job offer, compare the effective hourly rate to your adjusted living wage target. When you are making housing decisions, model what happens to your living wage target if you move to a different county. When you are evaluating whether a family member working part-time helps or breaks even after childcare costs, the calculator gives you the numbers to answer that question precisely.
The concepts in this guide become actionable the moment you apply them to your specific county and household. The free living wage calculator gives you the base figure in under a minute — then apply the adjustments from this guide to get your real income target.
Frequently Asked Questions
Does the living wage apply to immigrant households the same way as U.S.-born households?
The living wage figures produced by the MIT Living Wage Calculator apply to any household of the same size and type living in a given county — they do not change based on immigration status. However, the practical financial situation of many immigrant households differs from the model in important ways: remittances sent abroad add to effective monthly costs, credential non-recognition can suppress wages below what skills would otherwise command, some households are larger and multi-generational, and access to public benefits programs may be restricted depending on immigration status and time in the country.
This means many immigrant households need to earn above the standard living wage figure to achieve the same level of stability it is designed to represent. The adjustments described in this guide help close the gap between the published figure and the real household target.
How do remittances affect the living wage calculation for immigrant families?
Remittances are not included in the MIT Living Wage Calculator’s cost model, which covers only costs incurred within the U.S. If a household sends money to family abroad — a common commitment in many immigrant communities — those transfers function as an additional monthly expense that must come from income beyond what the living wage covers.
A household sending $300 to $500 per month abroad needs to earn that much more above the standard living wage threshold to maintain the same level of household stability. The formula is straightforward: multiply the monthly remittance amount by 12 to get the annual total, divide by 2,080 (full-time hours per year), and add the result to the base living wage figure.
Can undocumented immigrants use the living wage calculator?
The MIT Living Wage Calculator is a publicly accessible, anonymous research tool. No login, immigration status, or personal information is required to use it. Anyone can look up the living wage figure for any U.S. county by selecting their household type and location.
The figures it produces reflect what any household of that size in that county needs to cover basic costs, regardless of immigration status. Access the calculator through the Waldev living wage calculator page.
What happens to the living wage when adult family members live together in one household?
Multi-generational or extended household living can reduce the per-person living wage requirement because fixed costs like housing and utilities are shared across more adults. However, the MIT Living Wage Calculator does not have a pre-built configuration for multi-adult households beyond specific parent-child combinations.
The most practical approach is to add up the total household costs — rent, food, healthcare, transportation — and divide by the number of income-earning adults to find the per-person income target. Household cost-sharing is one of the most effective tools available for reducing the effective living wage requirement per person.
Are immigrant workers paid less than U.S.-born workers for the same work?
Research consistently shows a wage gap between immigrant and U.S.-born workers, though the size of the gap varies significantly by education level, English proficiency, field, and time spent in the country. Newly arrived immigrants often face wage penalties due to credential non-recognition, English language barriers, and limited professional networks — all of which tend to diminish over time as workers gain U.S. experience and credentials.
The wage gap is largest in the early years of residence and generally narrows over time. This makes the first several years after arrival the most financially vulnerable period for most immigrant households — which is precisely when careful living wage planning is most valuable.
What public benefit programs can immigrant households access?
Benefit program eligibility for immigrant households depends heavily on immigration status and time in the country. Lawful permanent residents who have been in the U.S. for five or more years are generally eligible for most federal benefit programs. Refugees and asylees typically have immediate access to federal benefits. Nonimmigrant visa holders are generally not eligible for public benefits. Undocumented immigrants are not eligible for most federal programs, though emergency Medicaid and some local programs may be accessible.
State programs vary widely — some states like California, New York, Washington, and Illinois have expanded benefit access beyond federal minimums. It is always worth checking eligibility with a local nonprofit or legal aid organization before assuming a household is ineligible.
How can I find the living wage for the specific county where I live?
The Waldev MIT Living Wage Calculator allows you to look up the living wage for any U.S. county by selecting your state, county, and household type (number of adults and children). It produces an hourly living wage figure based on the cost of housing, food, healthcare, transportation, childcare, and taxes for that specific location and household.
Use the living wage calculator to find your precise county-level figure, then apply the adjustments described in this guide — for remittances, cost-sharing, and integration expenses — to arrive at your actual household income target.
Apply This Guide to Your Household
This guide has covered the key ways the standard living wage figure needs to be adjusted for immigrant households: remittances, credential gaps, multi-generational cost sharing, and varying benefit access by immigration status. Understanding the framework matters — but the specific numbers for your household depend on where you live.
Every county in the U.S. has a different living wage. A household that is financially stable in Columbus, Ohio might be significantly underfunded in Seattle, Washington, at the same income level. The only way to know where you actually stand is to look up your specific county.
Use the MIT Living Wage Calculator on Waldev to look up the exact living wage for your county and household type. It takes under a minute, requires no account, and provides the precise starting figure you need to apply the adjustments in this guide.
Living wage by city — How the living wage benchmark compares across major U.S. metro areas.
Two-income households and the living wage — When both partners are working but still falling short.
Childcare costs and the living wage — Why childcare is the variable that changes the math most dramatically for families.
What a living wage budget actually looks like — The six cost categories broken down with real spending ranges.
Disclaimer: This article provides general educational information about the living wage concept and its application to immigrant households. All cost figures, wage ranges, and scenario numbers are illustrative estimates for educational purposes only. Living wage figures vary significantly by county — always use the MIT Living Wage Calculator to find the precise figure for your location. Benefit program eligibility rules are complex and change frequently; consult a qualified immigration attorney or nonprofit legal aid organization for guidance specific to your immigration status and household situation. Nothing in this article constitutes legal, financial, or immigration advice.