The 50/30/20 rule is probably the most repeated piece of budgeting advice on the internet. Fifty percent for needs, thirty percent for wants, twenty percent for savings — simple, clean, memorable. The only problem: for tens of millions of American households earning at or near the living wage, the math simply does not add up. This article puts the two frameworks side by side, runs the real numbers, and explains what that gap means for your budget.
What Is the 50/30/20 Budget Rule?
The 50/30/20 rule is a percentage-based budgeting framework popularized by Senator Elizabeth Warren and her daughter Amelia Warren Tyagi in the 2005 book All Your Worth. The concept is straightforward: divide your after-tax income into three buckets. Half goes to needs, thirty percent to wants, and twenty percent to savings or debt repayment.
Rent, groceries, utilities, transportation, insurance, minimum debt payments — anything you cannot reasonably cut.
Dining out, streaming, travel, clothing beyond basics, hobbies, gym memberships — things you choose to spend on.
Emergency fund, retirement contributions, extra debt payments beyond minimums, and any other financial goals.
The appeal is obvious. Instead of tracking every transaction in excruciating detail, you check three percentages at the end of the month. If your needs are above 50 percent, you look for fat to cut. If savings are below 20 percent, you find ways to shift spending. It is a high-level dashboard, not a line-item ledger.
The Income Assumption Hidden in the Rule
What tends to go unspoken is the income assumption embedded in the framework. The 50/30/20 rule works as a practical discipline when there is enough income that dividing it three ways produces meaningful amounts in all three categories. When your after-tax income is, say, $80,000 a year, 20 percent savings means $16,000 put away — a genuinely significant number. The 30 percent for wants gives you $24,000 of discretionary room. The buckets have enough volume to matter.
But the framework was not designed with a specific income floor in mind. It was designed as a proportion, applicable to anyone. The assumption — rarely stated directly — is that once you have income, splitting it in these ratios makes sense. What happens when the income itself is barely enough to cover the necessities? That is exactly the scenario faced by households at the living wage, and it is where the rule quietly stops working.
Before comparing any budget rule to your situation, you need your actual local number. The MIT Living Wage Calculator on Waldev gives you county-level living wage figures for any household type in seconds — free, no account needed.
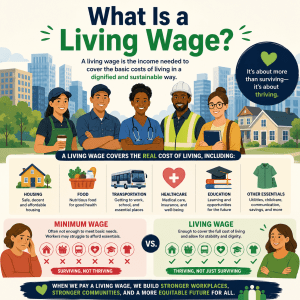
What the Living Wage Actually Covers
The MIT Living Wage model — the most widely cited standard in the United States — calculates the hourly wage a household needs to meet its basic expenses without relying on public assistance, credit, or savings drawdowns. It is not a prosperity benchmark. It is a basic sufficiency floor.
The model breaks the living wage into six cost categories:
Housing — Rent for a modest unit appropriate to the household’s size, based on local fair market rent data.
Food — A USDA Low-Cost Food Plan budget, assuming home cooking and no restaurant meals.
Transportation — Typically one car: loan payment, insurance, fuel, and maintenance at modest rates. Transit costs where applicable.
Healthcare — Out-of-pocket medical costs including premium contributions, assuming employer-sponsored coverage where available.
Childcare — Full-time center-based childcare for children under school age, where applicable. This is the single largest variable in the model for families.
Taxes — Federal and state income tax, payroll taxes, accounting for applicable credits such as the Earned Income Tax Credit.
Notice what is not in that list: no savings. No retirement contributions. No discretionary spending. No dining out, streaming services, clothing beyond bare necessity, or any leisure spending of any kind. The living wage is not designed to fund a comfortable life. It is designed to fund a viable one — the minimum income required to keep a household stable without going backward financially.
The key implication: If the living wage covers only six categories of necessity — and nothing else — then applying a budgeting rule that allocates 50% to needs assumes there is room above the living wage for wants and savings. For a household at the living wage, that room does not exist by definition.
The Living Wage Is Not a Take-Home Number
One detail that catches many people off guard: the living wage figures published by MIT are gross (pre-tax) hourly rates, not take-home pay. The model accounts for taxes as one of its six cost categories, but when you run a budget comparison, you need to work from after-tax income — which is what the 50/30/20 rule uses.
For a rough conversion: a household earning exactly the living wage will typically take home approximately 78 to 85 percent of their gross wage, depending on their state’s income tax rate and applicable credits. This distinction matters enormously when comparing the two frameworks, because the 50/30/20 split applies to the smaller after-tax number.
      Gross Living Wage (hourly) × 2,080 hours = Annual Gross Income

      Annual Gross Income × ~0.80 (approx. after-tax rate) = Annual Take-Home Pay

      Annual Take-Home Pay ÷ 12 = Monthly Take-Home Pay

      Monthly Take-Home Pay × 50% = Maximum "Needs" Budget Under 50/30/20
Once you run this chain of math, you can compare what the 50/30/20 rule allocates for needs against what those needs actually cost in your county. That comparison is where the framework either holds or falls apart.
Running the Math: Can 50/30/20 Work at the Living Wage?
Let’s build the comparison from scratch using illustrative figures consistent with mid-cost U.S. county data. We’ll start with the simplest household — a single adult with no children — and then layer in the complications.
Note on figures: All dollar amounts below are illustrative estimates based on the general structure of MIT Living Wage Calculator data for mid-cost U.S. counties. Actual figures vary significantly by county. Use the living wage calculator to find the precise figure for your location.
Scenario A: Single Adult, No Children, Mid-Cost County
For a single adult with no children in a mid-cost county — somewhere like Columbus, Ohio or Raleigh, North Carolina — the living wage typically falls in the range of $21 to $24 per hour. Let’s use $22 per hour as our example figure.
| Income Calculation | Amount |
|---|---|
| Gross hourly wage (living wage) | $22.00/hr |
| Annual gross income (2,080 hrs) | $45,760 |
| Estimated annual take-home (~81%) | ~$37,066 |
| Monthly take-home pay | ~$3,089 |
Now apply the 50/30/20 split to $3,089/month:
| Category | 50/30/20 Allocation | Estimated Actual Cost (Mid-Cost County) | Status |
|---|---|---|---|
| Needs (50%) | $1,545/month | — | — |
| Housing (1BR) | part of above | ~$1,100–$1,350/month | Tight |
| Food (home cooking) | part of above | ~$350–$420/month | Tight |
| Transportation (1 car) | part of above | ~$420–$560/month | Over |
| Healthcare (out-of-pocket) | part of above | ~$160–$240/month | Tight |
| Total estimated needs | $1,545 allowed | ~$2,030–$2,570 | Exceeds by $485–$1,025 |
| Wants (30%) | $927/month | $0 — needs consume all available income | Unreachable |
| Savings (20%) | $618/month | $0 — needs consume all available income | Unreachable |
The result is stark. Even for the simplest household type — one adult, no children, in a mid-cost county — basic needs consume somewhere between 66 and 83 percent of take-home pay, not 50 percent. There is nothing left for a “wants” bucket. Savings are not a budget category; they are a future aspiration.
Where the money actually goes vs. where the rule says it should go:
Bar widths are approximate for illustrative purposes using representative mid-cost county data. Your actual breakdown depends on your county’s living wage and specific costs.
📊 Before assessing any budget framework for your own situation, run your county’s living wage figure using the free Waldev calculator. The gap between what the rule prescribes and what your costs actually demand will vary significantly based on where you live.
Four Household Scenarios Side by Side
The single-adult scenario is the most forgiving case. As family size grows and childcare enters the picture, the gap between what 50/30/20 assumes and what basic life costs becomes substantially wider. Here are four representative scenarios using illustrative figures.
| Household Type | Approx. Living Wage (Mid-Cost County) | Est. Monthly Take-Home | Needs Budget at 50% | Estimated Actual Needs | Needs as % of Income | Savings Feasible at 20%? |
|---|---|---|---|---|---|---|
| Single adult, no children | ~$22/hr | ~$3,090 | $1,545 | ~$2,030–$2,570 | ~66–83% | No |
| Single adult, one child | ~$38–$42/hr | ~$5,100–$5,650 | $2,550–$2,825 | ~$4,700–$5,500 | ~85–97% | No |
| Two adults, no children (both working) | ~$19–$21/hr each | ~$5,100–$5,650 combined | $2,550–$2,825 | ~$3,200–$4,000 | ~57–70% | Marginally |
| Two adults, two children (both working) | ~$25–$29/hr each | ~$6,700–$7,800 combined | $3,350–$3,900 | ~$5,800–$7,200 | ~74–92% | No |
All figures are illustrative estimates based on the general structure of MIT Living Wage data for mid-cost counties. Actual results vary significantly by location. Run your specific numbers with the living wage calculator.
The two-adult, no-children household is the one scenario where 50/30/20 almost becomes viable at the living wage level — because both adults’ income combines while their shared expenses (housing, transportation) do not fully double. But even here, needs routinely land at 57 to 70 percent of combined take-home pay, not 50 percent. Savings at 20 percent remains a stretch.
For households with children, the arithmetic is unambiguous. Needs consume 85 to 97 percent of income at the living wage. The 50/30/20 rule is not a useful discipline in these cases — it is simply a target that the household’s income cannot mathematically reach.
Two adults, no children — income 1.5× living wage
Take-home: ~$7,800/month combined
Needs: ~$3,200–$3,800/month ≈ 41–49%
Wants at 30%: $2,340 — meaningful discretionary room
Savings at 20%: $1,560/month — significant wealth building
At 1.5× the living wage with no children, the three buckets function as designed.
Single parent, one child — income at the living wage
Take-home: ~$5,200/month
Needs: ~$4,800–$5,200/month ≈ 92–100%
Wants at 30%: $1,560 — does not exist in the budget
Savings at 20%: $1,040/month — structurally impossible
At exactly the living wage with one child, there is no budget left after necessities.
Why Standard Personal Finance Advice Breaks Down Here
The 50/30/20 rule is one example of a wider problem in mainstream personal finance advice: it was largely developed by and for people who had already cleared the income floor. When Warren and Tyagi wrote All Your Worth, the intended reader was a working American who had enough income to allocate but was not sure how to allocate it wisely. The framework is excellent for that audience. It is not the right tool for households where income is so constrained that allocation choices are not really choices at all.
The “Latte Factor” Problem
A related issue is the popular idea — sometimes called the “latte factor” — that financial struggles are primarily caused by small discretionary spending habits. Skip the daily coffee, and over decades it compounds into something significant. There is mathematical truth to this on its own terms. But for households at the living wage, it misdiagnoses the problem entirely.
A $5 daily coffee adds up to roughly $1,825 per year. If a single adult at the living wage in a mid-cost city faces a gap of $485 to $1,025 per month between what their income covers and what their basic necessities cost, eliminating coffee closes approximately 15 to 37 percent of that gap. The remaining gap is structural — rent, healthcare, transportation — and cannot be budgeted away with lifestyle changes.
The “Just Earn More” Response
A second common response to this analysis is: the solution is to earn more than the living wage, and then 50/30/20 will work fine. This is true, but it also somewhat misses the point. The living wage is not an exotic edge case. It is the income floor that millions of full-time workers in the United States currently earn. Many of those workers are told by financial media that a savings rate of 20 percent is the basic expectation for financial health. Understanding that this standard is simply unreachable at their income level is important — not as a source of shame, but as accurate information that should shape their financial expectations and policy conversations.
The useful framing: The living wage floor tells you what the minimum viable income is. The 50/30/20 rule tells you what becomes possible once you exceed that floor meaningfully. The gap between the two is the space where most personal finance advice becomes relevant. Use the living wage calculator to establish your floor, and then use a budgeting framework to manage your income above it.
The Housing Assumption Built Into the Rule
The original 50/30/20 framework had an implicit housing assumption built into it: that housing would consume something in the range of 25 to 30 percent of gross income, leaving the remaining 20 to 25 percent of gross to cover other necessities within the 50 percent ceiling.
That assumption may have been reasonable in many U.S. markets in 2005 when the framework was published. In 2025, it is structurally outdated in most major metro areas. The National Low Income Housing Coalition has documented that a worker earning minimum wage in most states would need to work well over 40 hours per week to afford a modest one-bedroom apartment at local fair market rent — and even living-wage earners face housing costs that consume 35 to 45 percent of their take-home pay in higher-cost markets, not 25 to 30 percent.
When the housing portion of the needs bucket alone approaches or exceeds 50 percent of take-home pay, the entire rule framework collapses from the first category. Everything else — food, transportation, healthcare — must come from whatever is left.
The Childcare Problem No Budget Rule Adequately Accounts For
Of all the cost categories in the MIT Living Wage model, childcare produces the most dramatic budget distortions for families trying to apply any standard budgeting framework. It is also the category that personal finance frameworks most consistently underestimate or ignore.
Center-based full-time childcare for one infant or toddler runs from approximately $800 per month in lower-cost rural areas to over $2,500 per month in high-cost metro areas. For a single parent earning the living wage — which already accounts for this childcare cost in its calculation — childcare alone consumes 20 to 35 percent of gross income before any other expense is paid.
| Location Type | Approx. Monthly Childcare (1 child) | Living Wage (Single Parent) Approx. | Childcare as % of Gross Income | Room for Other Needs After Housing + Childcare |
|---|---|---|---|---|
| Low-cost rural county | ~$800–$1,000 | ~$28–$32/hr | ~18–22% | Tight — minimal |
| Mid-cost county | ~$1,200–$1,600 | ~$36–$42/hr | ~20–26% | Very tight — little margin |
| High-cost metro | ~$1,800–$2,500 | ~$48–$60/hr | ~22–30% | Structurally consumed |
Illustrative estimates based on general childcare cost data and MIT Living Wage model structure. Actual figures vary by county and specific provider.
When childcare takes 20 to 30 percent of gross income, and housing takes another 30 to 40 percent, and you add food, transportation, and healthcare, the total needs calculation routinely hits 90 to 100 percent of take-home pay. The 50/30/20 rule allocates 50 percent to all needs combined. For a household with a child and childcare costs, that 50 percent ceiling is breached by housing alone in many markets.
The Hidden Savings Paradox for Parents
There is a cruel irony in the childcare cost structure. For households that reduce childcare by having one parent step back from full-time work, the immediate childcare saving is partially or fully offset by the income lost. In many households, the math suggests that one parent working full-time barely covers the cost of the childcare that work requires. This is not a budgeting problem — it is a structural income problem that no percentage-based rule can resolve.
For a deeper look at how childcare costs interact with living wage calculations across household types, see Childcare Costs and the Living Wage: The Full Story. Then run your own numbers with the living wage calculator to see the childcare component for your county.
Modified Budget Rules That Work Better at Living-Wage Income Levels
Abandoning a budget framework entirely is not the answer. Even when income is constrained, having a system for allocating what you have tends to produce better outcomes than no system at all. The issue is not with budgeting — it is with applying a framework calibrated for one income range to a completely different income range. Here are alternative approaches that are more realistic at or near living-wage income levels.
Option 1: Needs-First Budgeting (No Fixed Percentage)
Rather than starting with a target percentage, needs-first budgeting starts with actual costs. List every fixed necessity at its real monthly cost — rent, food, transportation, insurance, healthcare — and subtract the total from your monthly take-home. Whatever remains is the only amount available for any combination of discretionary spending and savings.
This is less elegant than 50/30/20 but far more honest. It tells you what you actually have to work with rather than what a framework says you should have. If the remainder after necessities is $200 per month, you know that $200 is your total flexibility — not $617 (20%) for savings and $927 (30%) for wants.
Option 2: The Modified 80/10/10 or 75/15/10 Rule
For households where necessities realistically consume 70 to 80 percent of take-home income, a modified split acknowledges reality while still building financial habits. Instead of targeting 50/30/20, target 80/10/10: 80 percent for needs and necessities, 10 percent for small discretionary spending (the “wants” equivalent), and 10 percent for savings.
Ten percent savings sounds modest, but at a living wage of $22 per hour and take-home of $3,089/month, it still produces $308/month — over $3,600 per year — toward an emergency fund or retirement account. Starting with a realistic saving rate is more valuable than setting an aspirational one and achieving zero because the target is out of reach.
All fixed costs at actual amounts. No target — spend what necessities actually cost.
Small flexibility for non-essential spending. Keeps some quality of life without ignoring constraints.
Even modest consistent savings builds an emergency cushion and long-term financial foundation.
Option 3: Zero-Based Budgeting
Zero-based budgeting assigns every dollar of income to a named category until the total equals zero — nothing is unallocated. Unlike percentage rules, it makes no assumptions about what proportion should go where. You start with your actual income, assign every dollar to a category based on your real expenses and priorities, and end with a plan that accounts for 100 percent of what you have.
For living-wage earners, zero-based budgeting often reveals that savings must be a deliberate line item — possibly a very small one — rather than a residual left after spending. Treating savings as a named category, even if it is $50 or $100 per month, is psychologically and practically different from hoping something is left at the end of the month.
Option 4: The Priority Stack
Some financial coaches working with lower-income households recommend a priority-stack approach rather than a fixed split. Allocate income in strict order of priority:
Pay rent or mortgage. This is non-negotiable — it has the most severe consequences if missed.
Keep the lights on and the household fed. These are survival-level priorities.
Protect the income source. Car payment, insurance, transit pass — whatever keeps you employed.
Even $25 to $50 per paycheck into a separate account, before anything discretionary. This builds the habit and the buffer.
Minimum insurance costs and any prescription needs. Deferred healthcare is a financial risk multiplier.
Whatever remains after steps 1–5 is available for all other spending, including discretionary wants.
The priority stack is not a percentage rule — it is a payment ordering system. It ensures that the most consequential expenses are covered first, and that savings becomes a line item before discretionary spending rather than an afterthought.
When Does 50/30/20 Actually Work?
The 50/30/20 rule is not bad advice. It is advice calibrated for a specific income range, and it functions well when the conditions it assumes are present. Understanding when those conditions exist — and when they do not — is the most useful thing this article can offer.
| Income Level (Relative to Living Wage) | Household Type | Can 50/30/20 Work? | Why / Why Not |
|---|---|---|---|
| At the living wage (1×) | Single adult, no children | No | Needs consume 66–83% of take-home in most markets |
| At the living wage (1×) | Single adult, one child | No | Childcare + housing + food consume 85–97% of income |
| At the living wage (1×) | Two adults, no children | Marginal | Shared housing helps; needs at 57–70%, savings limited |
| 1.2–1.3× living wage | Single adult, no children | Approaching | Needs drop to ~55–60% of income; small savings possible |
| 1.4–1.6× living wage | Single adult, no children | Yes | 50/30/20 begins to function as designed |
| 1.5–2× living wage | Two adults, two children | Approaching | Childcare remains a heavy burden; 50% needs challenging |
| 2× living wage or above | Most household types | Yes | Needs well below 50%; discretionary and savings room opens up |
Table rows are illustrative scenarios. Your specific situation depends on your county’s cost structure. Use the living wage calculator to establish your baseline, then assess which row most closely reflects your situation.
The key insight from this table: for single adults, 50/30/20 starts becoming feasible at roughly 1.4 to 1.6 times the local living wage. For households with children, the multiple is higher — because the living wage itself is already elevated by childcare costs, and those costs remain dominant in the budget even at higher income levels until children reach school age.
The Role of Geography
Geography is arguably the most underappreciated variable in any discussion of budget frameworks. A household earning $60,000 per year might comfortably hit 50/30/20 targets in rural Ohio, where the living wage for a single adult runs around $19 to $21 per hour. The same household in San Francisco — where the single-adult living wage approaches $30 to $35 per hour — would find that income barely covers necessities, let alone 30 percent wants and 20 percent savings.
This geographic reality is exactly why the living wage calculator is more useful than any national rule of thumb. The calculator gives you the county-specific number, which anchors every subsequent calculation — including whether any fixed-percentage budget framework is realistic for your location.
If you are considering relocating, the living wage figure for your destination county is an essential input. See Living Wage by City for a city-level overview, or use the Waldev living wage calculator for any specific county.
Practical Steps If Your Numbers Don’t Fit the 50/30/20 Rule
If you have run your numbers and found that your necessities consume significantly more than 50 percent of your take-home pay, here is a constructive action sequence — not a list of lifestyle cuts, but a genuine diagnostic and response framework.
Step 1: Establish Your Living Wage Benchmark
Before anything else, run the MIT Living Wage Calculator for your county and household type. This tells you what the income floor looks like for your specific situation. If your current income is below that floor, you are in a structural deficit — no budget optimization will close a structural gap. If you are at or slightly above the floor, you are in the zone where this article’s modified approaches become relevant.
📊 Run your figure at the Waldev MIT Living Wage Calculator — it takes under 60 seconds and gives you a county-specific baseline.
Step 2: Categorize Your Needs Honestly
Track one month of actual spending and categorize every expense as a need or a want — strictly. Many expenses that feel like needs are actually wants or are optimizable. A $200 per month car insurance bill may be reducible to $150 with some shopping around. A $120 per month phone plan may be replaceable with a $35 MVNO plan. These are not transformative savings, but they are real, and in a constrained budget, $50 to $100 per month matters.
The categories that are genuinely non-negotiable at their current cost are the structural problem. If your rent is $1,400 per month in a market where nothing cheaper is safe or accessible, that is a structural constraint — not a lifestyle choice. Identifying which costs are structural and which are optimizable is the most useful diagnostic you can run.
Step 3: Identify Your Actual Income Gap
Compare your monthly take-home to your total monthly necessities at their real costs. The difference — positive or negative — is your actual financial position. If it is negative, you are in a deficit that no budgeting framework can fix without either increasing income or reducing a major fixed cost. If it is a small positive, you are in the zone where modest savings are possible.
      Monthly Take-Home − Total Monthly Necessities = Available Margin


      If Available Margin is negative → Income increase or major cost reduction required

      If Available Margin is $0–$200 → Small savings possible; use 80/10/10 or priority stack

      If Available Margin is $200–$600 → Modified savings rate is realistic; approach 50/30/20 gradually

      If Available Margin is $600+ → 50/30/20 may apply; adjust based on your specific cost structure
Step 4: Automate Even Small Savings
If your margin after necessities is $150 per month, automate a $75 transfer to a separate savings account on payday. The amount is not the point — the habit is. Emergency fund contributions of any size reduce financial fragility meaningfully over time. A household with a $2,000 emergency buffer is in a qualitatively different financial position than one with none, even if both households technically earn the same wage.
Step 5: Reassess the Income Side
Budget optimization works best on the discretionary side of the ledger. When necessities consume 75 to 95 percent of income, the only lever that meaningfully changes the budget math is income. This is not a moral judgment — it is arithmetic. Skill development, negotiation, side income, or career transitions are the structural responses to a structural income constraint. The living wage figure gives you a clear income target to work toward: what hourly rate would bring your budget into viable territory for your household and county.
Using Living Wage Data to Negotiate Your Salary — How to turn the living wage figure into a concrete negotiation strategy.
Am I Earning a Living Wage? A Self-Assessment — A personal diagnostic guide for evaluating where your current income stands.
What a Living Wage Budget Actually Looks Like — All six cost categories in the MIT model broken down with real spending context.
Living Wage vs. a Comfortable Income — The income levels at which different financial goals — stability, thriving — actually become achievable.
Frequently Asked Questions
Common questions about the 50/30/20 rule and living wage incomes.
Does the 50/30/20 rule work on a living wage income?
In most cases, no — not as written. For a single adult at the living wage in a mid-cost county, the “needs” bucket alone often consumes 65 to 80 percent of take-home income, leaving little or nothing for wants or savings. The 50/30/20 rule was designed for households with meaningful financial headroom above their basic costs. At or near the living wage, it describes a target most budgets cannot realistically reach.
What should I use instead of 50/30/20 if I earn a living wage?
At living-wage income levels, needs-first budgeting is more practical. Cover your fixed necessities at their actual costs first, then apply any remaining margin to small savings — even 5 to 10 percent. A modified 80/10/10 or 75/15/10 split (needs / small savings / small discretionary) is more realistic and still builds positive financial habits without setting an unreachable target.
Why do needs cost more than 50% of income for many households?
The living wage model accounts for six core cost categories: housing, food, transportation, healthcare, childcare (where applicable), and taxes. In most U.S. counties, those six categories together consume between 95 and 105 percent of the living wage income itself — meaning the living wage is calibrated to absorb essentially all of it. When housing or childcare spikes above the modelled estimate, needs easily exceed 100 percent of income. The 50 percent threshold in 50/30/20 was not designed for incomes already fully committed to necessities.
Can you save money on a living wage?
Saving is possible on a living wage, but it requires either earning a few dollars per hour above the living wage floor or reducing costs in one major category — typically housing through shared arrangements. The living wage itself is defined as the income needed to meet basic needs without savings or debt. Genuine savings capacity typically begins once income reaches roughly 1.2 to 1.3 times the local living wage. Use the living wage calculator to find your specific figure and calculate how much above it you would need to earn.
Is the 50/30/20 rule bad advice?
It is not bad advice — it is advice designed for a specific income range. For households earning comfortably above the living wage, 50/30/20 is a useful discipline that prevents lifestyle inflation and keeps savings on track. The issue arises when it is presented as universally applicable across all income levels, creating an implied failure for households whose financial reality does not fit the framework. The rule is a tool, and tools work well when used in the right context.
How does childcare affect the 50/30/20 calculation?
Childcare breaks the 50/30/20 rule entirely for households at living-wage income levels. A single parent with one child in a mid-cost county typically needs to earn around $38 to $42 per hour as a living wage — and childcare alone can consume 20 to 30 percent of gross income. When combined with housing, food, transportation, and healthcare, needs routinely reach 85 to 97 percent of take-home pay, leaving the 30 percent wants and 20 percent savings targets completely unreachable. For families with children, 50/30/20 only starts to become viable at roughly 1.5 to 2 times the living wage.
What income level do you need for the 50/30/20 rule to actually work?
For a single adult in a mid-cost county, 50/30/20 begins to function meaningfully at roughly 1.4 to 1.6 times the local living wage — which translates to approximately $30 to $38 per hour in many markets. For family households with children, the multiple is higher because the living wage itself is already elevated by childcare costs. The most reliable way to determine your specific threshold is to run your county’s living wage using the Waldev calculator, then model what 1.4× and 1.6× of that number would look like in your actual budget.
Start With Your Real Number
Every budget rule — 50/30/20, 80/10/10, zero-based, priority stack — is a framework layered on top of your actual income and actual costs. Without knowing where you stand relative to the living wage in your county, any framework is being applied in a vacuum.
The MIT Living Wage Calculator gives you a county-specific, household-specific income floor in seconds. Once you know that number — and how your current income compares to it — you will know which budget framework is actually appropriate for your situation, and what income level you would need to reach for the 50/30/20 targets to become realistic.
Enter your county and household type. Get your living wage floor in under a minute. Free, no account required. Open the calculator →
From there, compare your actual income to the figure you get. If you are below the living wage, that gap is the primary financial challenge to address — no budgeting rule closes a structural income deficit. If you are at the living wage, use a modified approach like 80/10/10 or the priority stack. If you are meaningfully above the living wage, 50/30/20 becomes an increasingly useful discipline for managing the surplus you have built above the floor.
What a Living Wage Budget Actually Looks Like — A line-by-line breakdown of all six MIT cost categories with real spending context.
Living Wage vs. a Comfortable Income — The income levels where financial stability and genuine thriving begin.
Two-Income Households and the Living Wage — When two incomes still feel like not enough, and why.
Am I Earning a Living Wage? — A personal self-assessment guide for evaluating your current income against the local standard.
Disclaimer: This article uses illustrative income and cost figures for educational purposes. All living wage figures referenced are general estimates based on the structure of MIT Living Wage Calculator data and vary significantly by county and household type. The 50/30/20 budget scenarios presented are illustrative models, not financial projections. They should not be used as personal financial advice. For precise living wage figures applicable to your household and location, use the MIT Living Wage Calculator directly. All personal financial decisions should be made in consultation with a qualified financial professional where appropriate.