BMI Calculator
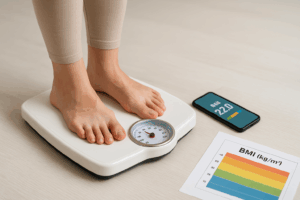
Calculate your Body Mass Index using metric or imperial units. Instantly see your BMI category, healthy weight range, and how your current weight compares with the normal BMI range.
Enter your details
Choose your unit system, enter your height and weight, then click calculate. The result appears below the calculator after clicking the button.
Free BMI Calculator – Complete Guide to Understanding and Using Your Body Mass Index
Body Mass Index — BMI — is one of the most widely used screening tools in modern medicine, and for good reason. A single number derived from nothing more than your height and weight can provide a fast, cost-free first signal about whether your weight is likely placing you at elevated risk for serious health conditions. Yet BMI is also widely misunderstood, misapplied, and in some contexts genuinely misleading. Whether you have just received a BMI result and want to know what it truly means, you are tracking a weight management journey, or you are simply trying to make sense of health advice you have been given, this guide gives you the full picture — the formula behind the number, how categories are defined, who the metric does and does not apply to, and what sensible next steps look like across every range of results.
Our free BMI calculator is part of a comprehensive library of health tools at WalDev, where you will find everything from body composition trackers to calorie estimators and clinical calculators — all free, all clearly explained, and all designed to support smarter health decisions rather than replace professional medical advice.
What Is BMI and Where Did It Come From?
Body Mass Index is a numerical value calculated from two pieces of information almost everyone already knows about themselves: their height and their weight. The result is a dimensionless number — it carries no unit — that places a person into a weight category reflecting where their mass falls relative to their stature. The categories range from underweight through healthy weight, overweight, and into three levels of obesity.
The formula has surprisingly old roots. Belgian mathematician and statistician Adolphe Quetelet developed what he called the Quetelet Index between 1830 and 1850, not as a medical tool but as part of his broader research into what he termed the “average man” — a statistical concept he was using to understand human physical characteristics at the population level. Quetelet noticed that for most adults, weight scaled not linearly but with the square of height, which led him to the weight-divided-by-height-squared relationship that persists today. The formula sat largely in the realm of epidemiology and actuarial science for over a century before it was brought to broader medical attention.
It was physiologist Ancel Keys who gave the measure its modern name in a 1972 paper examining different formulas for relating weight to height. Keys and his collaborators evaluated several candidate formulas and concluded that weight divided by height squared provided the most useful correlation with body fat at the population level. The term “Body Mass Index” was coined in that paper, and it subsequently became the standard measure adopted by the World Health Organization and national public health agencies around the world.
Today, BMI is used by physicians as a first-line screening tool, by insurers in health risk assessments, by researchers in epidemiological studies, and by individuals checking in on their own health. It is fast, free, and requires no equipment beyond a scale and a measuring tape. Those qualities make it enormously useful as a population screening tool. They also mean it carries the limitations inherent in any measure this simple — limitations that are important to understand before acting on any single BMI result.
BMI is a screening tool, not a diagnostic measure. A result outside the healthy range does not confirm a health problem — it identifies a signal worth discussing with a healthcare provider who can assess your complete clinical picture.
The BMI Formula Explained
The underlying mathematics of BMI are deliberately simple. There are two versions of the formula depending on whether you are working in metric or imperial units, but both produce identical results.
Metric formula
In the metric system, BMI is calculated as:
BMI = weight (kg) ÷ [height (m)]²
Example: 75 kg ÷ (1.75 m × 1.75 m) = 75 ÷ 3.0625 = 24.5
Imperial formula
In the imperial system using pounds and inches, a conversion factor of 703 is applied:
BMI = [weight (lbs) × 703] ÷ [height (inches)]²
Example: 165 lbs × 703 = 115,995 ÷ (68 in × 68 in) = 115,995 ÷ 4,624 = 25.1
The factor 703 is derived from the unit conversion between kilograms and pounds (1 pound ≈ 0.4536 kg) combined with the conversion from meters to inches (1 meter = 39.3701 inches). Working through the algebra: 1 kg/m² × (0.4536 kg/lb)⁻¹ × (39.3701 in/m)² ≈ 703. This conversion constant ensures that the same person gets the same BMI whether they enter their measurements in metric or imperial units.
Why height is squared
The squaring of height is the key mathematical insight behind BMI. If weight scaled simply with height (a linear relationship), then a person twice as tall who was geometrically similar would weigh only twice as much. But human bodies occupy three-dimensional space, and volume — which body weight approximates — scales with the cube of a linear dimension. The square, rather than cube, of height was chosen because empirically it provided the best correlation with body fat in the large populations Quetelet and later Keys examined. It is a statistical approximation, not a physiological truth, which is one reason BMI’s accuracy varies across individuals.
Converting height to meters
If your height is in centimetres, divide by 100 to get meters. For example, 175 cm = 1.75 m. If your height is in feet and inches, convert entirely to inches first (multiply feet by 12, then add remaining inches), then use the imperial formula.
Precision and rounding
BMI is conventionally reported to one decimal place. Because small errors in height measurement are squared in the formula, height accuracy matters more than weight accuracy. A one-centimetre error in height can shift BMI by 0.2 to 0.4 points, which is enough to move a result across a category boundary near the thresholds.
Standard BMI Categories and What Each Means
The World Health Organization and Centers for Disease Control and Prevention use the following classification system for adults aged 20 and over. These thresholds are applied uniformly regardless of age or sex in standard adult BMI classification, though important exceptions for ethnicity and age are discussed in their own sections further below.
| BMI Range | Weight Status | Health Implications | Category |
|---|---|---|---|
| Below 18.5 | Underweight | Potential nutritional deficiencies, bone density loss, immune suppression, fertility issues | Underweight |
| 18.5 – 24.9 | Healthy Weight | Generally associated with the lowest risk of weight-related chronic disease | Healthy |
| 25.0 – 29.9 | Overweight | Modestly elevated risk of cardiovascular disease, type 2 diabetes, hypertension | Overweight |
| 30.0 – 34.9 | Obesity Class I | Significantly elevated health risks; lifestyle and medical intervention often recommended | Obese I |
| 35.0 – 39.9 | Obesity Class II | Substantially increased risk; often qualifies for structured medical weight management | Obese II |
| 40.0 and above | Obesity Class III (Severe) | Highest risk category; may qualify for bariatric surgical intervention consideration | Obese III |
Understanding the healthy weight range in practice
The healthy weight range of 18.5 to 24.9 spans a meaningful weight difference for most heights. For a person who is 5 feet 7 inches (170 cm) tall, the healthy BMI range corresponds to body weights roughly between 119 pounds (54 kg) and 159 pounds (72 kg) — a span of 40 pounds or 18 kilograms. This range reflects genuine biological diversity in healthy body weight among people of the same height, not imprecision in the measurement.
The overweight range at 25.0 to 29.9 is often misunderstood as a clear disease category. It is not. Many people in this range have excellent metabolic health, normal cardiovascular risk profiles, and high fitness levels. The classification indicates that statistical risk of certain conditions is somewhat elevated relative to the healthy range — it does not mean a given individual is unhealthy or requires intervention. Context matters enormously, and that context is best assessed by a clinician rather than a BMI calculator alone.
The healthy BMI range was established based on the weight range associated with the lowest all-cause mortality risk in large population studies. It is a statistical center of gravity, not a bright medical line — people in the ranges just above or below it are not suddenly “healthy” or “unhealthy” by crossing a threshold.
How to Use the BMI Calculator Step by Step
Using our free BMI calculator takes under a minute, but getting the most from the result requires a few moments of preparation and some context for how to interpret what you see. Follow these steps for an accurate calculation and a meaningful reading of your result.
Stand against a flat wall without shoes and with your feet together. Use a flat-headed object like a book held level against the top of your head to mark the wall, then measure from the floor to that mark. Height measured while wearing shoes can add 2–4 cm (nearly an inch), which can shift your BMI by a meaningful amount. Use your most recent measured height rather than a remembered or estimated figure.
For the most representative weight, weigh yourself in the morning after using the bathroom and before eating or drinking. Body weight fluctuates by 1–3 kg (2–6 lbs) throughout the day due to hydration, food consumption, and other factors. Using a consistent weighing protocol removes most of this variability. Avoid weighing yourself immediately after intense exercise, as temporary dehydration can understate your actual weight.
Our calculator accepts inputs in either metric (kilograms and centimetres) or imperial (pounds and feet/inches) units. Choose whichever system you are most comfortable with — the result is mathematically identical regardless of which you use. If your height is recorded in a mix of feet and inches, convert fully to inches first: multiply feet by 12 and add the remaining inches before entering the value.
Enter your height and weight into the appropriate fields and click calculate. The calculator will display your BMI to one decimal place and highlight which category that result falls into. Take a moment to look at where your result sits within the category — a BMI of 24.6 is very different from 19.0, even though both are technically in the healthy range.
Consider your result alongside your age, sex, ethnicity, fitness level, and any known health conditions. A BMI of 27 for a competitive athlete with high muscle mass and low body fat is clinically very different from the same BMI in a sedentary individual with poor metabolic markers. Use the result as a conversation starter with a healthcare provider, not as a standalone verdict on your health.
Worked BMI Calculation Examples
The following fully solved examples illustrate how BMI is calculated across a range of heights, weights, and outcomes. Each includes the complete calculation and a brief interpretation of what the result means in practice.
Example 1 — Healthy weight adult (metric)
Person: Female, age 34, height 165 cm (1.65 m), weight 62 kg
Calculation: BMI = 62 ÷ (1.65 × 1.65) = 62 ÷ 2.7225 = 22.8
Category: Healthy weight (18.5–24.9). This result sits comfortably in the middle of the healthy range. No weight-related intervention is indicated, and routine health maintenance is the appropriate focus.
Example 2 — Overweight (imperial)
Person: Male, age 45, height 5 ft 10 in (70 inches), weight 210 lbs
Calculation: BMI = (210 × 703) ÷ (70 × 70) = 147,630 ÷ 4,900 = 30.1
Category: Obesity Class I (30.0–34.9). This result crosses the obesity threshold. A physician would typically recommend lifestyle assessment, blood pressure screening, fasting glucose and cholesterol tests, and a discussion of dietary and exercise modifications. For a muscular person, body fat percentage testing would help clarify whether the classification reflects true excess fat.
Example 3 — Underweight concern (metric)
Person: Female, age 22, height 170 cm (1.70 m), weight 50 kg
Calculation: BMI = 50 ÷ (1.70 × 1.70) = 50 ÷ 2.89 = 17.3
Category: Underweight (below 18.5). An underweight BMI in a young adult warrants medical attention to rule out nutritional deficiency, disordered eating, malabsorption, or other underlying causes. It would not be appropriate to assume this result simply reflects a naturally slight build without proper clinical evaluation.
Example 4 — Athlete with elevated BMI
Person: Male professional rugby player, age 28, height 183 cm (1.83 m), weight 110 kg
Calculation: BMI = 110 ÷ (1.83 × 1.83) = 110 ÷ 3.3489 = 32.8
Category: Obesity Class I — but this classification is clinically misleading. Measured body fat percentage in elite rugby players of this profile typically ranges from 10 to 15%, which is well within healthy ranges. The high BMI reflects exceptional muscle mass, not excess adiposity. This example illustrates why BMI must always be interpreted in the context of body composition and fitness level.
Example 5 — Older adult near the upper healthy boundary
Person: Female, age 70, height 160 cm (1.60 m), weight 68 kg
Calculation: BMI = 68 ÷ (1.60 × 1.60) = 68 ÷ 2.56 = 26.6
Category: Overweight — however, research in older adults suggests that a BMI in the range of 25–27 may be associated with the lowest mortality risk in this age group, contrary to the standard classification. Loss of muscle mass (sarcopenia) in aging means that a slightly higher BMI may reflect protective fat and muscle reserves rather than health risk. A geriatric physician would weigh functional assessments and body composition alongside BMI.
BMI for Children and Adolescents
The standard adult BMI categories do not apply to children and teenagers. Children are still growing, and their healthy weight ranges change continuously with age and vary between sexes. For this reason, pediatric BMI is interpreted using growth percentile charts rather than fixed numerical thresholds.
BMI-for-age percentiles
The Centers for Disease Control and Prevention publish BMI-for-age percentile charts for children aged 2 to 19 years, separately for boys and girls. These charts were developed from large population surveys and represent the distribution of BMI values across the U.S. population. A child’s BMI is calculated using the same height-and-weight formula as adults, but the result is then plotted against these reference curves to determine where it falls relative to children of the same age and sex.
| Percentile Range | Weight Status Category |
|---|---|
| Below the 5th percentile | Underweight |
| 5th percentile to below 85th percentile | Healthy Weight |
| 85th percentile to below 95th percentile | Overweight |
| Equal to or above the 95th percentile | Obese |
Because BMI changes substantially through childhood and puberty — typically rising in infancy, falling through the preschool years, then rising again through adolescence in what is called the adiposity rebound — a raw BMI number without its percentile context is nearly meaningless for a growing child. Two 10-year-olds with the same BMI of 19.0 will fall in different percentile categories depending on whether they are boys or girls, and whether 19.0 is high or typical for their age.
Never use adult BMI categories to assess the weight status of anyone under age 20. The CDC’s BMI-for-age percentile charts, available through your pediatrician or the CDC website, are the appropriate tool for this age group. If you are concerned about a child’s weight, consult a pediatrician rather than relying on any online calculator or general guideline.
How Ethnicity, Sex, and Age Affect BMI Interpretation
One of the most significant limitations of a single universal BMI classification system is that it does not account for meaningful differences in the relationship between BMI and body fat — or between BMI and health risk — across different population groups. Understanding these differences is not a matter of political nuance; it has real clinical consequences for who receives appropriate screening and intervention.
Asian populations
Research has consistently shown that people of Asian descent accumulate more visceral abdominal fat at lower BMI values than European populations, and that their risk of type 2 diabetes, cardiovascular disease, and hypertension rises at BMIs that standard categories classify as healthy. The World Health Organization has published data suggesting lower action points for Asian populations: overweight at BMI ≥ 23.0 and obesity at ≥ 27.5. Several countries in East and South Asia have adopted these lower thresholds in national health guidelines. For individuals of South Asian ancestry — including people from India, Pakistan, Bangladesh, and Sri Lanka — the metabolic risk associated with any given BMI appears particularly elevated compared to European norms.
Black populations
Research indicates that people of African descent, particularly Black women, may carry more muscle mass at any given BMI than white populations, which can cause BMI to overestimate adiposity and health risk. Some studies suggest that the standard obesity threshold of 30.0 overestimates cardiovascular risk in Black populations, and that a higher threshold might be more appropriate. However, this evidence is less consistent than in Asian populations, and healthcare providers generally still use the standard thresholds while applying additional clinical judgment.
Sex differences
The standard BMI formula and categories are applied identically to men and women despite the fact that women typically carry 8 to 10 percentage points more body fat than men at the same BMI. This occurs because women’s bodies are hormonally adapted for reproductive function, which requires higher fat stores. A woman and a man with the same BMI of 24 will likely have meaningfully different body fat percentages, yet receive identical BMI category labels. Some researchers have argued for sex-specific BMI thresholds, though this has not yet been reflected in major clinical guidelines.
Age considerations
As people age, they tend to lose muscle mass and bone density while gaining fat, even when their body weight remains stable. This means that an older adult’s BMI may underestimate their actual fat percentage. Some research suggests that a slightly higher BMI range (approximately 25–27) is associated with better health outcomes in adults over 65 than in younger populations. Additionally, short-stature elderly individuals who have experienced height loss due to spinal compression may have inflated BMI readings compared to their actual fat content.
These considerations do not render BMI useless — they mean that BMI results should be interpreted with demographic awareness and that individuals from groups where standard thresholds may not apply should discuss their specific situation with a healthcare provider who is familiar with these differences. For a more direct assessment of body fat, the Body Fat Percentage Calculator at WalDev provides an alternative perspective based on body measurements.
Significant Limitations of BMI as a Health Metric
BMI’s great virtues — speed, simplicity, and zero cost — come with genuine trade-offs. Understanding what BMI cannot tell you is as important as understanding what it can, particularly if you are making health decisions based on a single number.
Does not measure body fat directly
BMI is a proxy for adiposity, not a measurement of it. Two people with identical BMIs can have very different body fat percentages — the difference between 18% and 35% is clinically enormous, yet both may yield the same BMI. This is the core weakness of the measure.
Cannot distinguish muscle from fat
Both muscle and fat contribute equally to the weight that enters the BMI formula. This means that highly muscular individuals — athletes, bodybuilders, manual laborers — are routinely misclassified as overweight or obese despite having very low body fat and excellent health markers.
Ignores fat distribution
Where fat is stored in the body matters enormously for health risk. Visceral fat stored around the abdominal organs is metabolically far more harmful than subcutaneous fat stored under the skin. BMI is entirely blind to this distribution — it treats a pound of abdominal fat and a pound of thigh fat identically.
Problematic at height extremes
The squared-height formula systematically underestimates BMI in very short individuals and overestimates it in very tall ones. Research suggests that above approximately 6 feet 1 inch (185 cm), BMI progressively overstates adiposity even for people with average body composition.
Not validated across all populations
The original BMI research was conducted predominantly in European populations. The formula’s relationship to body fat percentage and health risk differs across ethnic groups, and no single set of thresholds fits all populations well.
Ignores bone density
Heavier bones — common in athletic populations and some ethnic groups — contribute to weight without any corresponding increase in health risk. Individuals with naturally higher bone density may consistently fall one category higher than their actual fat content would suggest.
These limitations are not reasons to dismiss BMI — they are reasons to treat it as the preliminary screening tool it was designed to be. At the population level, BMI remains a powerful predictor of health outcomes. At the individual level, it requires interpretation alongside other clinical information. The health calculators section at WalDev includes several complementary tools that together provide a more complete picture of health status than BMI alone.
According to the World Health Organization’s obesity and overweight fact sheet, BMI provides the most useful population-level measure of overweight and obesity — while explicitly acknowledging that it is a rough guide and may not correspond to the same degree of fatness across different individuals. This balanced view — useful at scale, limited at the individual level — is the appropriate lens through which to interpret any BMI result.
Better Ways to Assess Body Composition Beyond BMI
Because BMI does not directly measure body fat and cannot distinguish fat from muscle, several alternative or complementary metrics provide more accurate and clinically meaningful information. None is as effortless to obtain as BMI, but each addresses at least one of BMI’s key blind spots.
Waist circumference
Measuring the circumference of the waist at the level of the navel provides direct information about central adiposity — abdominal fat — which is the component of excess weight most strongly associated with cardiovascular disease, insulin resistance, and metabolic syndrome. The NHS and many cardiology guidelines consider a waist measurement above 88 cm (35 inches) in women and 102 cm (40 inches) in men to represent substantially elevated cardiovascular risk, regardless of BMI category. Waist circumference is inexpensive, takes under a minute, and provides information BMI simply cannot supply.
Waist-to-height ratio
Dividing waist circumference by height produces a dimensionless ratio that adjusts abdominal fatness for body size in a way that raw waist circumference does not. A widely cited guideline suggests that a waist-to-height ratio below 0.5 is associated with substantially lower cardiometabolic risk across diverse populations. Some researchers consider waist-to-height ratio a stronger predictor of cardiovascular risk and mortality than BMI, particularly in populations where BMI performs poorly. If you want to track changes in central fat distribution over time, this ratio is a practical and informative alternative. The Body Fat Percentage Calculator provides further measurement-based body composition assessment.
Body fat percentage
Body fat percentage directly quantifies what BMI only estimates. Methods include DEXA (dual-energy X-ray absorptiometry) scanning, which is the gold standard; hydrostatic weighing; air displacement plethysmography (the Bod Pod); and portable measures such as skin-fold caliper assessment and bioelectrical impedance analysis (BIA). Consumer BIA scales are widely available and, while not as precise as clinical methods, can track trends in body composition over time. Healthy body fat ranges are approximately 10–20% for men and 18–28% for women, though these vary by source, age, and athletic status.
Ponderal Index
The Ponderal Index divides weight by height cubed rather than squared, which corrects some of BMI’s known distortions at height extremes. While less commonly used in clinical practice, it is theoretically more sound for comparing body composition across very tall and very short individuals. The formula is: Ponderal Index = weight (kg) ÷ height (m)³.
The most robust assessment of weight-related health risk combines BMI, waist circumference (or waist-to-height ratio), blood pressure, fasting glucose, HbA1c, and a lipid panel. No single number captures the full complexity of metabolic health — a panel of indicators provides a far more reliable picture.
BMI and Chronic Disease Risk — What the Evidence Shows
Decades of epidemiological research have established clear statistical relationships between BMI categories and the risk of numerous chronic conditions. These associations are well-established at the population level and inform clinical guidelines for preventive care. Understanding them can help contextualize your BMI result in terms of what it might mean for your long-term health — while keeping in mind that statistical associations describe populations, not individuals.
Type 2 diabetes
The relationship between elevated BMI and type 2 diabetes risk is among the strongest in epidemiology. Risk rises substantially in the overweight range and dramatically in obesity. Excess adipose tissue — particularly visceral fat — drives insulin resistance, which is the precursor to type 2 diabetes. Weight loss of even 5–10% of body weight can produce meaningful improvements in insulin sensitivity and blood glucose control, and in some cases can lead to remission of early-stage type 2 diabetes.
Cardiovascular disease
Excess weight is associated with elevated blood pressure, adverse lipid profiles (raised triglycerides, reduced HDL cholesterol), endothelial dysfunction, and chronic low-grade inflammation — all established cardiovascular risk factors. However, the relationship is complex: a phenomenon called the “obesity paradox” has been observed in some patient populations with established cardiovascular disease, where moderately overweight individuals show comparable or better outcomes than those with lower BMI. This paradox may reflect the role of muscle mass, which BMI cannot distinguish from fat mass.
Sleep apnea
Excess weight, particularly around the neck and upper airway, is a major modifiable risk factor for obstructive sleep apnea. Weight gain of as little as 10% can meaningfully increase sleep apnea severity. Conversely, significant weight loss — whether through lifestyle changes or bariatric surgery — consistently reduces sleep apnea severity and in many cases resolves it entirely. For individuals who snore heavily or wake unrefreshed, even a borderline-elevated BMI warrants sleep evaluation.
Joint and musculoskeletal conditions
Every kilogram of excess body weight places approximately 4 kilograms of additional load on the knee joints during walking — a well-established biomechanical relationship. Obesity is one of the strongest modifiable risk factors for osteoarthritis of the knee and hip. Weight loss reduces both joint load and the systemic inflammatory state associated with excess adiposity, and is a primary component of osteoarthritis management in overweight individuals.
Certain cancers
The International Agency for Research on Cancer has identified excess body weight as a cause of at least 13 types of cancer, including cancers of the colon, rectum, endometrium, postmenopausal breast, kidney, liver, and pancreas. The mechanisms are multiple and include chronically elevated insulin levels, sex hormone imbalances, and adipose-derived inflammatory cytokines that promote cellular proliferation.
Mental health
The relationship between BMI and mental health is bidirectional and complex. Higher BMI is associated with elevated rates of depression and anxiety, driven partly by social stigma and partly by the physiological effects of chronic inflammation and hormonal disruption that accompany excess adiposity. Conversely, depression and other mental health conditions increase risk of weight gain through altered eating behaviours, reduced physical activity, and the metabolic side effects of some psychiatric medications.
If you are concerned about cardiovascular health specifically, the ASCVD Risk Calculator at WalDev provides a 10-year cardiovascular event risk estimate based on multiple clinical parameters — a much more comprehensive cardiovascular risk picture than BMI alone can provide. Similarly, if you are tracking caloric intake as part of weight management, the Calorie Calculator can help establish daily energy targets aligned with your weight goals.
What to Do With Your BMI Result
A BMI result should be a starting point for reflection and, in some cases, action — not a sentence. Here is how to think through what your result means and what appropriate next steps look like for each category.
If your BMI indicates you are underweight
An underweight result warrants a conversation with a healthcare provider. The causes of low BMI are diverse and include nutritional deficiency, gastrointestinal conditions affecting nutrient absorption, thyroid disorders, other metabolic conditions, and eating disorders. Some people are genuinely and healthily lean without any underlying problem, but this cannot be safely assumed without professional evaluation. The health consequences of sustained underweight include bone density loss (increasing fracture risk), immune suppression, nutrient deficiencies, hormonal disruption, and in severe cases, organ dysfunction. Do not attempt to address underweight through unsupervised rapid weight gain strategies — the causes should be identified first.
If your BMI is in the healthy range
Maintaining a healthy BMI over time is associated with the lowest risk of weight-related chronic disease. Focus on the lifestyle habits that support continued health: varied whole-foods nutrition, regular physical activity, adequate sleep, stress management, and routine preventive health screenings. If you are near either boundary of the healthy range, tracking waist circumference alongside BMI gives additional assurance that body composition is moving in the right direction. Checking BMI once or twice per year as part of routine health monitoring is sufficient.
If your BMI falls in the overweight range
An overweight BMI is a signal, not a crisis. Begin by assessing whether your BMI result reflects actual excess fat or whether your body composition is atypically muscular. If you have a sedentary lifestyle and high waist circumference alongside a BMI in the 25–29.9 range, lifestyle modification — specifically increased physical activity and dietary quality improvement — is likely to produce meaningful health benefits even without targeting a dramatic weight change. A loss of 5–10% of body weight in this range is associated with measurable reductions in blood pressure, cholesterol, blood glucose, and inflammation. Consult your doctor for a full metabolic screening panel if you have not had one recently.
If your BMI falls in an obesity category
For BMI values of 30 and above, the evidence supporting active intervention is strong. However, the nature of appropriate intervention varies by health status, degree of obesity, and individual circumstances. Lifestyle modification through improved nutrition and increased physical activity is the foundation of management for all obesity categories. For Class II and Class III obesity, structured medical weight management programs, pharmacotherapy, and in selected cases bariatric surgery may be appropriate options — decisions that require thorough evaluation by a healthcare provider. Importantly, the goal of intervention is improved health, not cosmetic thinness — even modest weight loss of 5% to 10% of starting weight produces clinically meaningful metabolic improvements. You can use the Calorie Calculator on WalDev to establish an informed daily calorie target as part of a structured nutrition approach.
BMI is a screening tool. No decision about diet, exercise, medication, or surgery should be based on BMI alone. Any concern raised by a BMI calculation should be discussed with a qualified healthcare provider who can assess your complete individual health picture. This content is educational and is not medical advice.
Common BMI Mistakes and Misconceptions to Avoid
Despite its simplicity, BMI is frequently misunderstood and misused in ways that lead people to draw incorrect conclusions. These are the most common errors — and how to avoid them.
Treating BMI as a health verdict
BMI is a screening filter, not a diagnosis. A single BMI number cannot tell you whether you are healthy or unhealthy — it identifies a statistical risk pattern that may or may not apply to your specific case. People with elevated BMIs can be metabolically healthy, and people with normal BMIs can have serious metabolic problems. The BMI result should prompt further inquiry, not close the question.
Using self-reported height and weight
Research consistently shows that people tend to overestimate their height and underestimate their weight, which systematically deflates self-reported BMI. The error is small on average but enough to shift a result across a category boundary in borderline cases. For meaningful BMI tracking, use measured values rather than recalled or estimated ones.
Applying adult categories to children
This is a particularly consequential error. Children’s BMIs are interpreted on percentile charts, not fixed category thresholds. A BMI of 20 might be perfectly healthy for a 16-year-old but concerning for a 7-year-old, depending on where it falls on the age and sex-specific percentile curve. The adult table is simply not applicable to anyone under 20.
Ignoring muscle mass
Athletes, strength trainers, and people who do significant physical labor often have BMIs in the overweight or even obese range despite carrying very little body fat. Using BMI to guide health decisions for these individuals without accounting for body composition leads to incorrect conclusions and potentially harmful advice.
Obsessive frequent tracking
BMI is derived from body weight, which fluctuates daily by 1 to 3 kilograms due to hydration, food intake, hormonal cycles, and other factors. Checking BMI daily — or even weekly — introduces noise that can create anxiety and distort trend perception. Monthly tracking is adequate for most monitoring purposes.
Ignoring waist measurement
Two people with identical BMIs can have dramatically different distributions of that weight. The person who carries most of their excess weight in the abdomen (apple shape) faces substantially higher cardiovascular and metabolic risk than someone of the same BMI who carries weight predominantly in the hips and thighs (pear shape). Relying on BMI without waist circumference is a meaningful gap in health assessment.
Frequently Asked Questions About BMI
These questions address the most common points of confusion, concern, and curiosity about Body Mass Index — from the basics of calculation to nuanced clinical interpretation.
What is a healthy BMI range for adults?
According to standard WHO and CDC classifications, a healthy BMI for most adults falls between 18.5 and 24.9. A BMI below 18.5 is considered underweight, 25.0 to 29.9 is overweight, and 30.0 or above is classified as obese. These thresholds apply to most adults aged 20 and older but may differ for certain ethnic groups, athletes, and older individuals. For people of Asian descent, overweight is often identified at a BMI of 23.0 or higher due to differing relationships between BMI and metabolic risk in this population.
How is BMI calculated in both metric and imperial units?
In metric units: BMI = weight in kilograms ÷ (height in meters)². In imperial units: BMI = (weight in pounds × 703) ÷ (height in inches)². Both formulas yield identical results for the same person — the factor 703 is a unit conversion constant. For example, someone who is 175 cm tall and weighs 80 kg has a BMI of 80 ÷ (1.75)² = 80 ÷ 3.0625 = 26.1, placing them in the overweight category.
Is BMI accurate for everyone?
BMI is a population-level screening tool, not a direct measure of body fat, and it is not equally accurate for all individuals. It can be misleading for athletes with high muscle mass (who may be categorised as overweight despite low body fat), older adults with low muscle mass, pregnant women, people of Asian descent (who face higher health risks at lower BMI values), and very tall individuals (whose BMI tends to be understated by the formula). Always interpret BMI alongside other health metrics such as waist circumference, blood pressure, and blood tests rather than in isolation.
What is BMI-for-age and why is it used for children?
Children and adolescents grow at different rates, so their BMI must be interpreted relative to age and sex rather than fixed adult thresholds. BMI-for-age percentile charts published by the CDC are used for anyone aged 2 to 19. A child is classified as underweight below the 5th percentile, healthy weight between the 5th and 85th percentiles, overweight between the 85th and 95th percentiles, and obese at or above the 95th percentile. Using adult BMI categories for children is incorrect and can lead to significantly wrong assessments.
Can you have a normal BMI but still be unhealthy?
Yes, absolutely. This condition is sometimes called normal-weight obesity or “metabolically obese normal weight.” A person with a BMI in the healthy range (18.5–24.9) can still have a high percentage of body fat, particularly if they have low muscle mass, are sedentary, carry excess abdominal fat, or have poor dietary habits. These individuals can have insulin resistance, elevated triglycerides, hypertension, and other metabolic risk factors despite a BMI that appears acceptable. This is one of the key reasons BMI alone is insufficient for health assessment.
What BMI is considered obese, and are there degrees?
Obesity begins at a BMI of 30.0 and is further divided into three classes that reflect increasing severity of associated health risks. Class I obesity covers BMI 30.0 to 34.9, Class II covers 35.0 to 39.9, and Class III (also called severe, extreme, or morbid obesity) begins at 40.0. Each class is associated with progressively higher risks of type 2 diabetes, cardiovascular disease, sleep apnea, joint disorders, and certain cancers. Treatment intensity and options generally increase alongside class, with Class III obesity often prompting evaluation for bariatric surgical intervention.
How does BMI differ in its interpretation for men and women?
The standard BMI formula and categories are identical for men and women, even though biological reality differs. Women typically carry 8 to 10 percentage points more body fat than men at the same BMI, due to hormonal differences related to reproductive function. This means that at a given BMI, a woman will generally have a higher body fat percentage than a man — but clinical BMI thresholds do not currently account for this difference. Some researchers have argued for sex-specific thresholds, though standard guidelines still apply the same categories across sexes.
Does ethnicity significantly affect how BMI should be interpreted?
Yes, the relationship between BMI and health risk is meaningfully different across ethnic groups. Research shows that people of Asian descent — particularly South Asian — accumulate visceral fat and face metabolic health risks at lower BMI values than European populations. The WHO has proposed lower action points for Asian populations (overweight at BMI ≥ 23.0, obese at ≥ 27.5), and several Asian countries have adopted these thresholds nationally. People of African descent may carry more muscle mass at a given BMI, meaning standard categories may overestimate adiposity in this group. These differences are clinically significant and should be discussed with a healthcare provider familiar with ethnicity-specific risk profiles.
What is the difference between BMI and body fat percentage?
BMI is an indirect estimate calculated from height and weight only. Body fat percentage is a direct measurement of the proportion of total body weight that consists of fat tissue, determined through methods such as DEXA scanning, hydrostatic weighing, Bod Pod testing, or skin-fold caliper measurement. Body fat percentage is a more precise indicator of body composition, while BMI is faster and cheaper to obtain. A healthy body fat percentage is roughly 10–20% for men and 18–28% for women, though ranges vary by age, sex, and measurement method. The Body Fat Percentage Calculator at WalDev can help you estimate this value from body measurements.
How often should I check my BMI?
For adults maintaining a stable weight, checking BMI once or twice a year provides a reasonable long-term picture. If you are actively working toward a weight loss or weight gain goal, monthly checks alongside waist circumference measurement allow you to track meaningful trends without being misled by normal short-term fluctuations. Daily BMI checking is not useful — body weight fluctuates by 1 to 3 kilograms throughout the day and from day to day due to hydration, digestion, and other factors, which produces BMI variation that reflects noise rather than genuine change.
What is the healthy BMI range for older adults?
For adults over 65, some research suggests that a BMI in the range of 25 to 27 — technically classified as overweight by standard criteria — may be associated with better health outcomes and lower mortality than the standard healthy range of 18.5 to 24.9. This counterintuitive finding likely reflects the protective role of body reserves and muscle mass in older adults, where the muscle loss of sarcopenia means that a somewhat higher total weight can represent a healthier body composition than the same weight in a younger adult. Clinicians caring for older patients typically assess BMI alongside functional measures, nutritional status, and muscle strength rather than applying standard thresholds rigidly.
Can BMI predict my personal risk of developing chronic disease?
BMI is a statistically significant predictor of chronic disease risk at the population level, but it is considerably less reliable as an individual predictor. Large studies confirm that higher BMI is associated with greater rates of type 2 diabetes, cardiovascular disease, hypertension, sleep apnea, certain cancers, and joint disorders. However, because BMI does not directly measure body fat, cannot assess its distribution, and does not capture other metabolic markers, a better individual risk assessment combines BMI with waist circumference, blood glucose, cholesterol levels, blood pressure, smoking status, family history, and lifestyle factors. The ASCVD Risk Calculator available on WalDev provides a more comprehensive cardiovascular risk picture.
What is the relationship between BMI and daily calorie needs?
Your BMI does not directly determine your calorie needs, but it is indirectly related because body weight — which drives BMI — is one component of total daily energy expenditure. Heavier individuals generally burn more calories at rest and during activity. However, the most accurate calorie estimates require factoring in age, sex, weight, height, and activity level through a formula such as the Mifflin-St Jeor equation. For practical calorie goal setting aligned with weight management, the Calorie Calculator on WalDev gives a far more actionable estimate than BMI alone.
What should I do if my BMI shows I am in the obese range?
The first step is to consult a healthcare provider who can assess whether the BMI accurately reflects your health status — particularly relevant if you are athletic or muscular. If weight management is appropriate, a comprehensive approach typically includes dietary changes that create a calorie deficit without causing nutritional deficiency, increased aerobic and resistance exercise, behavioral support strategies, sleep optimization (poor sleep significantly impairs weight management), and stress management. For Class II and III obesity, structured medical programs, pharmacotherapy with approved medications, or bariatric surgery evaluation may be discussed. Sustainable weight loss of 0.5 to 1 kg per week is generally preferred over rapid loss, which tends to cause muscle loss and eventual weight regain.
Who invented the BMI formula?
The formula was developed by Belgian mathematician Adolphe Quetelet between 1830 and 1850 as part of his work on social statistics. He called it the Quetelet Index. The term “Body Mass Index” was coined by physiologist Ancel Keys in a 1972 paper that evaluated different methods for relating body weight to height. Keys concluded that Quetelet’s weight-divided-by-height-squared formula provided the best population-level correlation with body fat. The World Health Organization and national health agencies subsequently adopted BMI as a standard screening measure, and Keys’s naming has been universal ever since.
Are there better alternatives to using BMI alone?
Several alternatives and complements to BMI offer more precise or more appropriate assessment for specific purposes. Waist circumference directly measures central fat and is a stronger individual predictor of cardiovascular risk than BMI. Waist-to-height ratio — keeping waist circumference below half your height — is a simple, cross-population guideline with strong research support. Body fat percentage measured by DEXA, hydrostatic weighing, or skin-fold assessment gives the most direct body composition picture. The Ponderal Index corrects some of BMI’s height-related distortions. A panel combining BMI, waist circumference, blood pressure, fasting glucose, and a lipid panel provides a substantially more complete health risk picture than any single measure.
Does losing or gaining weight always change my BMI category?
Not always. How much weight change is required to shift BMI category depends on how close your current result is to a boundary and what your height is. For a person who is 170 cm (5 ft 7 in) tall, moving from overweight (25.0) to healthy weight (24.9) requires a weight change of only about 0.3 kg (less than one pound). Moving from one full BMI point to another requires roughly 1 kg at average heights. This means that meaningful metabolic health improvements can occur with weight changes that do not shift the category label at all — and that BMI category changes are not the appropriate primary goal of weight management, better metabolic health is.
Is BMI the same as Ideal Body Weight?
No. BMI is a measurement of your current weight status. Ideal Body Weight (IBW) is a clinical target weight calculated from height using historical formulas such as the Devine, Hamwi, or Robinson equations. IBW represents a benchmark weight at which drug dosages, medical device sizing, and some clinical risk thresholds are calibrated — it is not a cosmetic or lifestyle target. The Reverse BMI Calculator on WalDev takes a target BMI value and calculates the corresponding target weight for your height, which is a more flexible tool for personalised goal-setting than fixed IBW formulas.
A Final Word on Using BMI Wisely
Body Mass Index has been part of public health practice for over half a century for a simple reason: at the population level, it works remarkably well as a first-pass signal. It takes seconds to calculate, requires no equipment, and correctly identifies the broad weight categories associated with health risk for the large majority of adults. These qualities make it an enduring and valuable tool in medicine, public health, and personal health monitoring.
At the same time, BMI was never designed to be — and should never be treated as — the final word on any individual’s health. It does not see muscle from fat, abdominal from peripheral fat, or metabolic health from body weight. The person who uses their BMI result as a starting point for a broader health conversation — with their doctor, with complementary metrics, with honest self-assessment — is using it correctly. The person who accepts it as an absolute verdict on their health status is asking more of it than it can deliver.
All of the free tools at WalDev are built with this philosophy in mind: clear calculations, honest explanations, and no pretence that a single number tells the whole story. Explore the full range of health calculators to build a more complete picture of your health, and bring what you find to a qualified healthcare professional who can give it the clinical context it deserves.
Medical Disclaimer: The content on this page is for general educational and informational purposes only. It does not constitute medical advice and is not a substitute for professional medical evaluation, diagnosis, or treatment. Always seek the guidance of a qualified healthcare provider regarding any health concerns or before making changes to your diet, exercise routine, or medication.